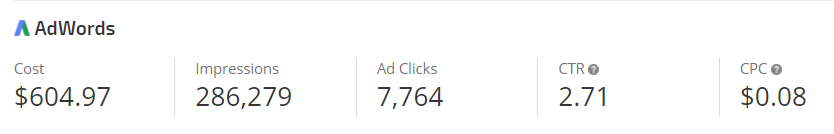
Search our Knowledge Base
Search

Traffic Summary


The Search Traffic Summary is the main dashboard for Google Analytics overview data. Customize the display of this report in white label dashboards and PDF reports by setting graphs, charts, tables, and columns to show or hide.

This traffic analysis report can be filtered by:
  • Key metric (e.g., sessions, page views, bounce rate, goal completions, etc.) (UA accounts - Goal Completions, GA 4 - Event Count)
  • Goals (i.e., all goals or specific goals) (Universal Analytics)
  • Segments (e.g., mobile traffic, device type, social traffic, etc.) (Universal Analytics)
  • Search type (Organic, Organic Paid, Exclude Organic, Exclude Paid)
  • Specific keywords
  • Event category (Universal Analytics)
  • Custom Google Analytics Developer options 

Important! 
  • Google Analytics integration is required, please refer to this documentation
  • To include AdWords metrics in this report AdWords must be linked to the site's Google Analytics profile, refer to Google's support document.
  • Currently, Google Analytics 4 Integration: 
    • Supports partial reporting
    • The Google Ads and segments are not available
    • The Goals option is replaced by the Events
    • The New Users metric is not available in the Traffic Overview
    • Has Limited Filters

Analytics Overview
Located in: Site Traffic (Analytics) > Overview > Traffic Summary
 

Analytics Traffic Summary

 
Analytics Search Traffic Overview Report

Traffic Graph

 
Key Metric Graph

Traffic Graph Features
  • The graph can be set to display or hide, in Report Options > General Settings > Report Sections > Traffic Graph, graph labels can be turned on or off in that same section
  • The Key Metric can be selected in Report Options > Analytics Settings > Key Metrics; the default is Sessions. 
  • A Compare to Past feature can be enabled in Report Options > Date settings
  • Google algorithm changes can be enabled to display in the graph in Report Options > General Settings > Report Sections > Rank Risk Index
  • Notes can be set to display in the graph in Report Options > Notes
  • Hover over any point or number on the graph to view daily details for the selected key metric     

Traffic Overview Metrics

 
Traffic and Goal Achievements

Below is the image for the report with the Universal Analytics connection. In the Google Analytics 4 report, the Goal Completions and the Goal Conversion is replaced by Event Completions and Event Conversion. The New User metric is currently not available for the GA 4 connection.
Traffic Metric Features
  • This metrics table can be set to display or hide in Report Options > General Settings > Report Sections > Traffic Overview (note that both Traffic Overview and Traffic Metrics must be set to display)
  • A Compare to Past feature can be enabled in Report Options > Date settings
  • To include Goal metrics, Goals must be selected in Report Options > Analytics Settings > Conversions > --All Goals-- or select individual ones from the list
  • For clarification, New User Sessions % is based on Google's ga:percentNewSessions metric that represents the percentage of sessions by users who had never visited the site before. It does not represent the number of new users between one period and the previous. In this Google Developer document, it is described as the calculation of ga:newSessions / ga:sessions

New vs Returning Users Chart


The New vs Returning chart can be set to display or hide in Report Options > General Settings > Report Sections > Traffic Overview (note that both Traffic Overview and New vs Returning must be set to display).   
The New Users metric is based on Google's ga:newUsers metric and represents the number of sessions marked as a user's first sessions.


Top Channels Chart


The Top Channels chart can be set to display or hide in Report Options > General Settings > Report Sections > Traffic Overview (note that both Traffic Overview and Top Channels must be set to display)  


Device Overview Chart

 
The Device Overview chart can be set to display or hide in Report Options > General Settings > Report Sections > Traffic Overview (note that both Traffic Overview and Device Overview must be set to display)  


Google Ads Metrics


PPC Performance Summary
The AdWords table can be set to display or hide in Report Options > General Settings > Report Sections > AdWords 
As mentioned at the beginning of this documentation, the current version of the GA 4 API does not support Google Ads.

To include AdWords metrics in this report AdWords must be linked to the Google Analytics profile, refer to Google's support document.

Top Referrers Table


Referral Traffic

For the Google Analytics 4 accounts, the Goal columns are replaced by the Event Completions column.
Top Referrers Table Features
The following columns can be set to show or hide in Report Options > General Settings > Report Sections > Top Referrers:
  • Pages / Session
  • Goal Completions (Universal Analytics)
  • Goal Conversions % (Universal Analytics)
  • Event Count (GA4 connections)
The number of results to display in the table can be selected in the same Report Options section. This is very useful when adding this table to a white label PDF report or dashboard to share with clients.

Top Keywords Table


Keyword Search Referrals

Top Keywords Table Features
  • This table can be set to show or hide in Report Options > General Settings > Report Sections > Top Keywords
  • The number of results to display in the table can be selected in the same Report Options section. This is very useful when adding this table to a white label PDF report or dashboard to share with clients. 

Report Options

 
Report Title


Dates

  • Select Report Dates from the Report Options calendar tool or select a Custom Date Range in the top right toolbar
  • Check the Compare to Past box and select a period, if desired.

    If "Previous Period" is elected and the report date range is set to a 31-day month (e.g., July), and the previous month has only 30 days (e.g., June), then the report will include the last day of the month prior to that (e.g., May 31). This is the way Google calculates the dates in their reports.

    We also offer a "Calendar Month(s)" option that compares each full calendar month in the report date range to the previous month(s). For example, if you select a report period of April 1 - May 31 (i.e. 61 days), the previous Calendar Months compared will be February 1 - March 31 (59 days), even though the total number of days in the 2 periods are not the same. As opposed to the "Previous Period" setting, resulting in a comparison period of January 30 - March 31 to match the 61 days of April 1 - May 31.

    The "Same Time Last Year" setting matches exact dates (e.g., January 1, 2018 - June 30, 2018, compared to January 1, 2017 - June 30, 2017).
Analytics display settings

Display Settings

  • Custom Report Title: (optional) enter text to display as the report's title
  • Data Source Icon: display or hide Google Analytics and Google Ads icons next to custom report and section titles for the related data type
  • Algorithm Updates: display or hide the notation of Algorithm Updates in the top graph
  • Notes: display or hide Single Date or Date Range Notes in the top graph
select columns to display

Report Sections

Display or hide the display of the following sections and columns:
  • Traffic Graph
    • Graph Labels
  • Traffic Overview
    • include Traffic Metrics
    • include New vs. Returning Users Pie Chart
    • include Top Channels Pie Chart
    • include Device Overview Chart
  • Google Ads data (Google Ads account must be linked to the site's Google Analytics profile - refer to Link Google Analytics and Google Ads)
  • Top Referrers Table
    • include Pages/Session
    • include Goal Completions (Universal Analytics)
    • include Goal Conversions % (Univeral Analytics)
    • include Event Count (GA 4)
    • Limit Results: select the maximum number of results to display
  • Top Keywords Table
    •  Limit Results: select the maximum number of results to display
Google Analytics key metric

Google Analytics Filter by Key Metric

Select to filter data by a specific metric:
  • Sessions
  • Page Views
  • Bounce Rate
  • Users
  • New Users
  • New Users (%) (Universal Analytics)
  • Pages per Session
  • Goal Completions (Univeral Analytics)
  • Event Count (GA 4)
Analytics Goals and Conversions

Conversions

Show or hide goal data:
  • Hide Goals
  • All Goals (Universal Analytics)
  • All Events (GA 4)
  • Specific Goals that appear in the list are based on the goals that have been created in the Google Analytics account for the property
Filter Goal data by:
  • All Sessions
  • All Goals
  • Specific Goals that appear in the list are based on the goals that have been created in the Google Analytics account for the property

Select the Currency symbol type from the list of world currencies. The currency option is available in case Google doesn't send us the correct currency settings. We don't run a currency conversion, we simply display the numbers that pass from AdWords to Google Analytics to Rank Ranger, and you have the option to set the currency symbol based on what you have set up in your Google AdWords account.

Additional Analytics Filters

Additional Segment, Search Type & Keyword Filters

  • Filter by Segments (optional) that are available in the connected Google Analytics account (Univeral Analytics)
  • Choose the desired Search Type:
    • All
    • Organic
    • Paid
    • Organic & Paid
    • Exclude Organic
    • Exclude Paid
  • Enter Keyword(s) (optional) if you want to filter the report by a keyword. Enter a plus (+)  before positive keywords and minus (-) before negative keywords with a space between each keyword/phrase in the Filter by Keyword field.  More information...
  • Select an Event Category (optional) based on Events that have been created for the connected Google Analytics account. (Universal Analytics)
  • Set a Custom Filter: refer to Google's Metric Filter and Dimension Filter support documentation
Click the Apply Changes button

Google Analytics API limits the number of requests from an IP address for a domain each day. If you see a screen in our Analytics section that displays titles but no data, it could be that you/your team have exceeded that threshold by multiple rechecks. Logging in from a different IP address or waiting until the next day should resolve the issue. Please contact us if the issue is not resolved within 24 hours.

Landing Page Tags for Google Analytics Reports


Landing Page Tags Settings
In the Campaign Settings > Landing Pages screen for display in Google Analytics widgets utilizing the Page dimension, Analytics Traffic Overview and Top Traffic Pages reports:
  • URL Address: enter only the portion of the URL after the domain for the path that applies to the page. For example, if the full URL is https://example.com/shop/blue-jeans, then enter /shop/blue-jeans in the URL address field.
  • Enter Tag: enter a Tag / Friendly Name for the URL as you want it displayed in the report

add Google Analytics Landing Page tags


Google Analytics Example
The settings in the Landing Page Tags screen above are reflected in this Google Analytics Chart / List widget
Key Metric: Sessions with Dimension: Page, and Exclude Home Page settings were used in this example  

Google Analytics Friendly Tags example

Add to PDF Report


Conveniently add a report or graph with its current settings to a PDF report by hovering over the gold gear icon and selecting Add to PDF Reports

add report to PDF


Select the PDF Report that you want the report or graph added to
             
select white label report

Drag the new report or graph into the position you want it to display in the PDF and confirm that the Date settings do not conflict with the automated scheduling settings.

PDF Report Settings - Overview

Reports and graphs can be added to automated PDF reports via the report screen (as described above) or manually in the PDF Report Content screen. If the report is added via the:
  • report screen, then begin by clicking the Edit button corresponding to the report
  • PDF Report Content screen, then click the Add Report button and select the Campaign name and Report: Traffic Overview.

Date


Expand the Date Options section and in the Show Report date of the last field type in the number of periods to be displayed in the report

In the next field select one of the following options:
  • days
  • weeks
  • months
  • years
In the data ending on field select one of the following options:
  • first day
  • last day
  • or a specific day of the month
  • or a specific day of the week (when weekly reports are selected)
In the of field select one of the following options:
  • this
  • last
In the next field select one of the following options:
  • week
  • month
The selection must produce a logical date setting based on the PDF report's automated scheduling (at the bottom of the Report Details screen). For example:
  • last day of last month
  • 1st of this month
  • last day of last week
If the report is scheduled to be sent every Monday, then the following example would be invalid:
  • Saturday of this week (because weeks begin on Sunday and if reports are sent on Monday, then Saturday of this week hasn't yet occurred).
If the report is scheduled to be sent on the 1st day of every month, the following example would be invalid:
  • last day of this month (because it's only the 1st day of the month the report is being sent)

Widget Settings


Custom Report Title (optional): displays across the top of the report section

Select a widget Color by clicking on the color square to expand the color chart

Display Totals by moving the slider to the right

Display the Chart by moving the slider to the right

Determine the widget Width by inputting a percentage

Analytics Settings


Select a Key Metric from the  menu for specific filters.


Add to Marketing Dashboard


Conveniently add a report or graph with its current settings to a marketing dashboard:

1. Hover over the gold gear icon and select Add to Marketing Dashboard
2. Select the Dashboard (campaign name)
3. Select the Dashboard Page that you want the report added to


add report to PDF


4. Click the "Go to Dashboard" link to further customize the report (e.g., drag it to a specific position on the page, change date settings, etc.)


Refer to the Report Options section for details regarding the display settings, filters and sort options available for this report.

The report date (or date range) is governed by the selected Dashboard date option: Date Selection or Fixed Periods, learn more...

  • Daily reports default to the last day of the selected period
  • Weekly and monthly reports default to 1 month of data
To change the number of weeks or months displayed in a specific report, click the gear icon for any marketing dashboard report element and expand the Date option section, enter the number and click the Save Button.
 
marketing dashboard report date options


Add to Client Dashboard


Customize Report for Client Dashboard

Client Dashboards display our default report options for each individual report and graph until you modify them. To customize the display of the report, expand the Report Options section, change the settings and click the Apply Changes button.

Then expand Report Options again and hover over the Save icon and select Save as Default for Client Dashboard.

report options

After saving the Client Dashboard default, any changes that you make to the report options will not affect the display in the Client Dashboard unless you overwrite it by following these instructions again.


Enable the Report or Graph to display in the Client Dashboard

Open the Campaign Settings > Client Dashboard screen and check the box corresponding to the report(s) you want displayed in the dashboard, and then click the Save button. 

access permissions to client dashboard


Refer to Client Dashboard Settings documentation for additional instructions for customizing your dashboard.


Google Analytics Reports and Graphs

Google Search & Ad Metrics Glossary


The below-listed metrics are only for the Google Analytics Universal Profile connection.
Wondering what some of the Google metrics in our reports and graphs mean? 

Ad Clicks Displays the number of times viewers of a banner click on an ad to view the full offer.
All Users Total of new users and returning users for a given period of time.
Assisted Conversions Google's measure of any interaction, other than the final click, that led to a consumer converting on a website.
Assisted Value The total value of the conversions assisted by the channel.
Attribution The process of assigning credit for sales and conversions to touchpoints in conversion paths.
Attribution allows marketers to quantify each channel's contribution to sales and conversions. For example, many people may purchase on your site after searching for your brand on Google.
Refer to this Google Support document for more information.
Avg. Time on Site Displays the average length of time a visitor spent on a particular page or set of pages.
Avg. Value A calculation of Event Value / Total Events.
Bounce Rate Displays the percentage of single-page visits (i.e. visits in which the person left your site from the page they entered through without going deeper inside your site).
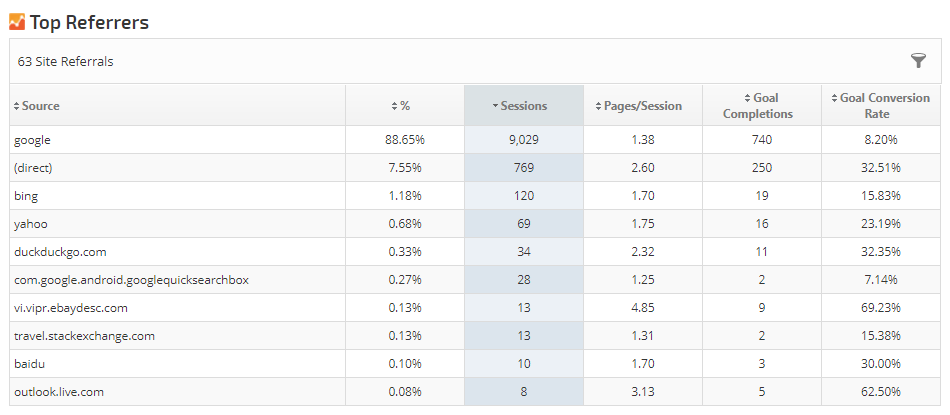
Completions The total number of users who have completed all elements defined for a particular goal.
Conversion A completed activity, online or offline, that is important to the success of your business. Examples include a completed sign-up for your email newsletter (a Goal conversion) and a purchase (a transaction, sometimes called an Ecommerce conversion).
Refer to this Google Support document for more information.
Conversion Rate The number of conversions is divided by the number of total ad clicks that can be tracked to a conversion during the same time period.
Cost The total cost of Google AdWords campaigns, in currency units defined by the Google account user.
Channel Grouping A roll-up of traffic sources in the Acquisition reports that groups several marketing activities together. Channel groupings allow you to view and compare aggregated metrics by channel name, as well as an individual traffic source, medium, or campaign name.
Refer to this Google Support document for more information.
CPC (Cost Per Click) Cost-per-click is the average cost an advertiser paid for each click on search ad(s).
CTR (Click Through Ratio) Displays the Click-through-ratio for an ad.  This is equal to the number of clicks divided by the number of impressions the ad received.
Dimension A descriptive attribute or characteristic of an object that can be given different values.
For example, a geographic location could have dimensions called Latitude, Longitude, or City Name. Values for the City Name dimension could be New York, London, etc.
Refer to this Google Support document for more information.
Event A type of hit used to track user interactions with content. Examples of user interactions commonly tracked with Events include downloads, mobile ad clicks, gadgets, Flash elements, AJAX embedded elements, and video plays.
Refer to this Google Support document for more information.
Event Value A calculation of Total Event * Value.
Exit Rate How often do users end their session or leave the site after viewing a particular page
Goal A configuration setting that allows you to track the valuable actions, or conversions, that happens on a site or mobile app.
Goals allow you to measure how well your site or app fulfills your target objectives.
Refer to this Google Support document for more information.
Hits An interaction that results in data being sent to Analytics. Common hit types include page tracking hits, event tracking hits, and e-commerce hits.
Each time the tracking code is triggered by a user’s behavior (for example, the user loads a page on a website or a screen in a mobile app), Analytics records that activity. Each interaction is packaged into a hit and sent to Google’s servers.
Refer to this Google Support document for more information.
Impressions (Ads) The measurement of how many times an ad is shown.
Impressions (Search Console) An impression is the display of a website link in search results or an advertisement. This metric accounts for the total number of impressions recorded by Google for a website or ad campaign.
Last Interaction Conversions The ratio of assisted/last interaction conversions. This is a number that indicates whether this channel primarily results in last interaction conversions or is predominantly assisted conversions. Numbers of 1.5 and higher indicate that this channel is predominantly accounting for assisted conversions, while numbers closer to 0 indicate the channel’s contribution to conversions is predominantly as the last interaction.
Last Interaction Value The total value of the conversions completed by the listed channels.
Metric Individual elements of a dimension that can be measured as a sum or a ratio.
For example, the dimension City can be associated with a metric like Population, which would have a sum value of all the residents of the specific city.
Refer to this Google Support document for more information.
New Users New Users is based on Google's ga:newUsers metric and represents the number of sessions marked as a user's first sessions.
New Users % New Users % is based on Google's ga:percentNewSessions metric that represents the percentage of sessions by users who had never visited the site before. It does not represent the number of new users between one period and the previous. In this Google Developer document, it is described as the calculation of ga:newSessions / ga:sessions
New Visits Displays the number of new visits by people who have never been to the site before.
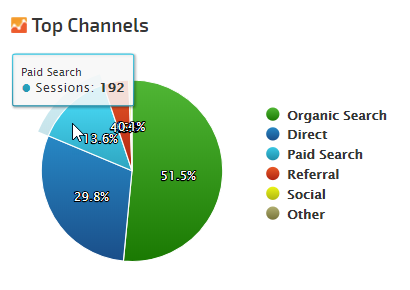
Organic Traffic Number of users who find your website ‘organically’ through search results, as opposed to via a paid ad, clicking a link on another site, or from a bookmark they already have saved.
Paid Traffic Number of visitors to your site who came there via Google Ads, paid search keywords and other online ad campaigns.
Pageviews An instance of a page being loaded (or reloaded) in a browser.
Pageviews is a metric defined as the total number of pages viewed.
Refer to this Google Support document for more information.
Permission The right to perform administrative and configuration tasks, to create and share assets, and to read and interact with report data.
Refer to this Google Support document for more information.
Property A sub-component of an Analytics account that determines which data is organized and stored together.
Refer to this Google Support document for more information.
Revenue Specifies the total revenue or grand total associated with the transaction (e.g. 11.99). This value may include shipping, tax costs, or other adjustments to total revenue that you want to include as part of your revenue calculations.
Roll-Up Reporting A feature of Roll-Up Properties, which aggregate data from multiple source properties into a single property.
Refer to this Google Support document for more information.
Sampling The practice of selecting a subset of data from your traffic and reporting on the trends detected in that sample set.
Refer to this Google Support document for more information.
Segment A subset of sessions or users that share common attributes.
Segments allow you to isolate and analyze groups of sessions or users for better analysis.
Refer to this Google Support document for more information.
Session The period of time a user is active on your site or app.
By default, if a user is inactive for 30 minutes or more, any future activity is attributed to a new session.
Refer to this Google Support document for more information.
Sessions with Event The number of sessions during which an Event was recorded.
Source / Medium Source: the origin of your traffic, such as a search engine (for example, google) or a domain (example.com).
Medium: the general category of the source, for example, organic search (organic), cost-per-click paid search (cpc), web referral (referral).
Refer to this Google Support document for more information.
Tags Referring to Google Tag Manager, a Tag is a snippet of JavaScript that sends information to a third party, such as Google. The Analytics tracking code is an example of a tag.
Refer to this Google Support document for more information.
Total Events A total of Events (executions of a specific action) that occurred on a website during a specified period of time.
Unique Events The number of unique events that occurred on a website during a specific period of time.
Unique Page Views The number of times a page was viewed during a specific time period.
Views The number to views a website or specific web page received during a report period.
Visits By Medium Displays the number of visits by medium through which your site was reached. For example, every referral to a website also has a medium. Possible mediums include: "organic” (unpaid search), "cpc” (cost per click, i.e. paid search), "referral” (referral), "email” (the name of a custom medium you have created), "none” (direct traffic has a medium of "none”).
Visits By Source Displays the number of visits by source that brought visitors to your website. For example, every referral to a web site has an origin, or source. Possible sources include: "google” (the name of a search engine), "facebook.com” (the name of a referring site), "spring_newsletter” (the name of one of your newsletters), and "direct” (users that typed your URL directly into their browser, or who had bookmarked your site).

We will update this periodically, but in the meantime if there are metrics you're curious about that aren't listed in this glossary, please refer to this Google support document.


Get the ultimate SEO tools with the Rank Ranger Software
Learn More About Rank Ranger