The Site Audit Overview serves as a summary dashboard and launching point for deep analysis of individual Issues and Pages.
Site audits can be scheduled for any website that is being tracked in the General Settings screen of a campaign. Learn how to schedule a crawl.
- SEO
- Rank Tracker
- Local SEO
- Mobile SEO
- Link Manager
- Landing Pages
- Social Signals
- On-Page Optimization
- Enterprise SEO Solutions
- Marketing
- Competition Analysis
- Insight Graph
- Keyword Research
- Graphs & Widgets
- Market Reach
- Marketing KPI
- Brand Visibility
- White Label SEO
- Marketing Dashboard
- Client Dashboard
- PDF Reports
- PDF Templates
- Other
- Email Notifications
- Portfolio Management
- Integrations
- Google Analytics
- Search Console
- Pay Per Click
- WeDevelop
- API
Site Audit Overview Report
Located in Reports & Tools > Organic Search > SEO Audit
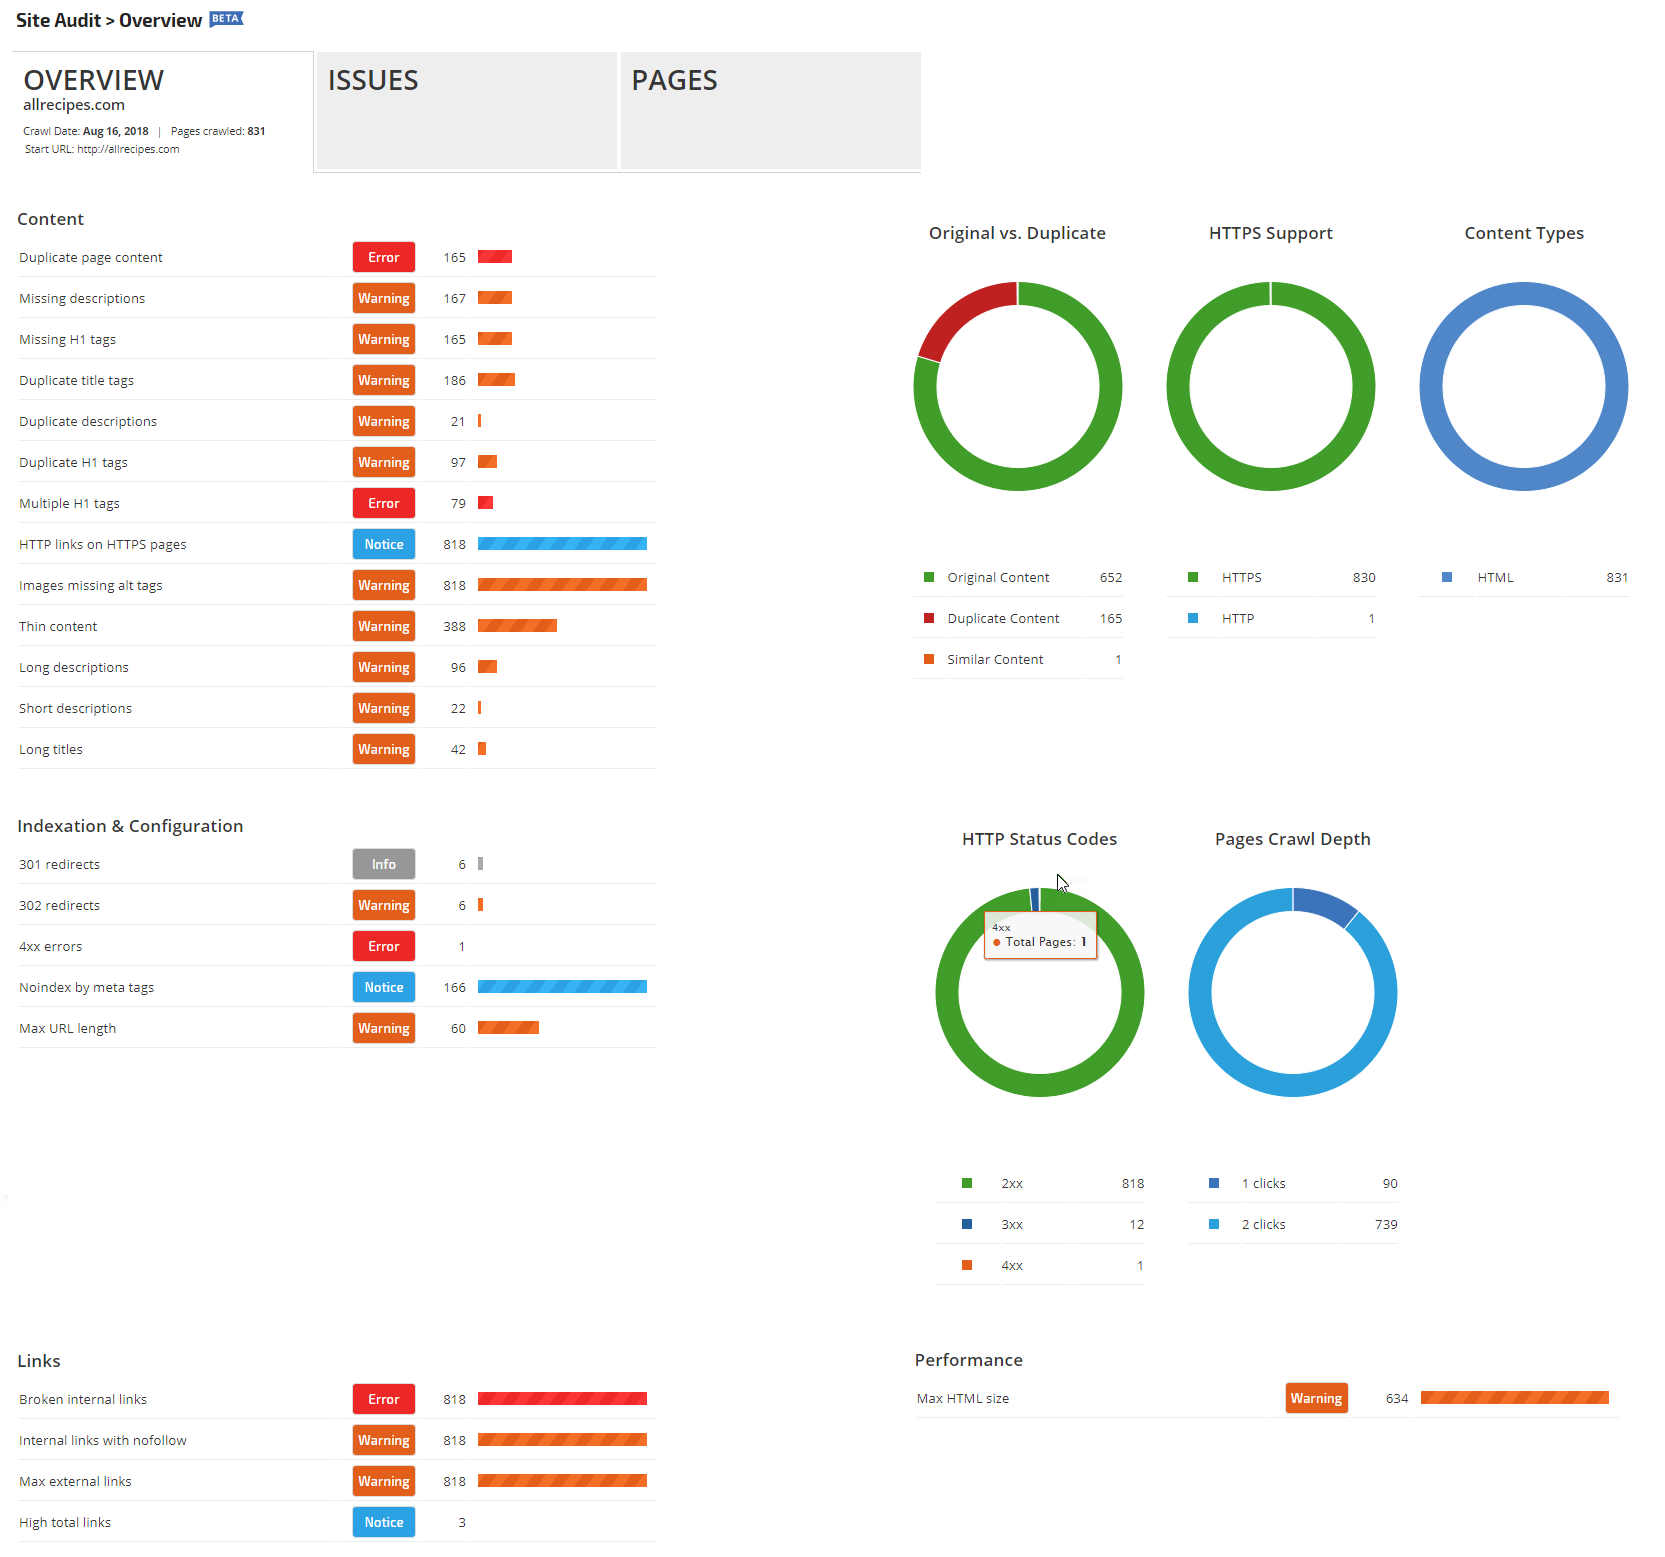
Audit Dashboard
Content Errors, Warnings, and Notices
In this section, you'll find a list of errors, warnings, or notices if any issues were detected during the site audit.
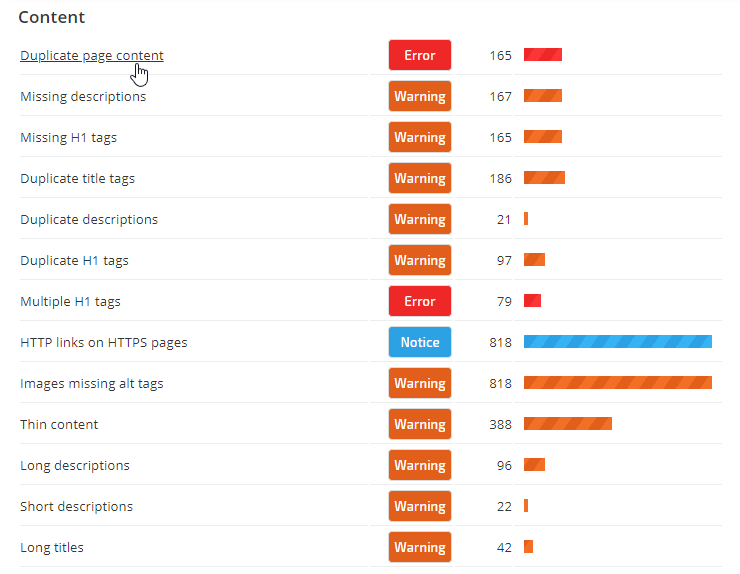
In this section, you'll find a list of errors, warnings, or notices if any issues were detected during the site audit.
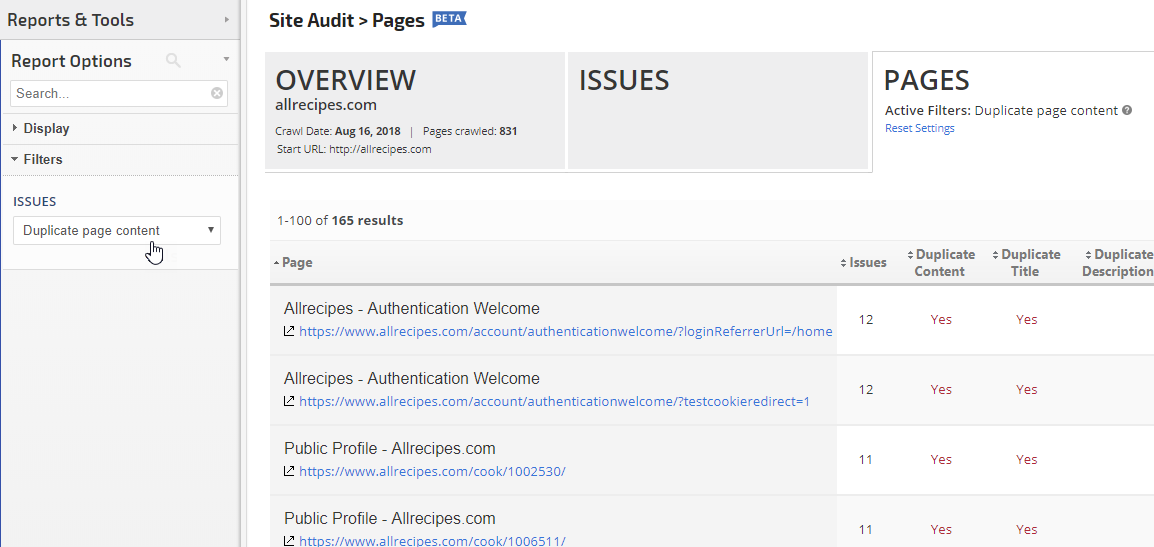
Clicking the links in the Content section launches the Pages report filtered for the error, warning, or notice
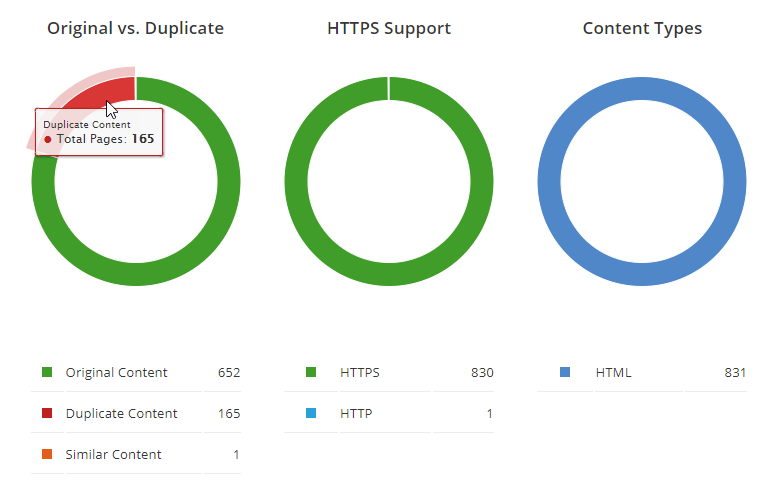
Content Duplication, HTTPS Support & Content Types
Redirects, Errors, Noindex, and URL length
In this section, the status of potential performance issues is reported. Clicking any of the items listed launches the Pages report filtered for that issue.
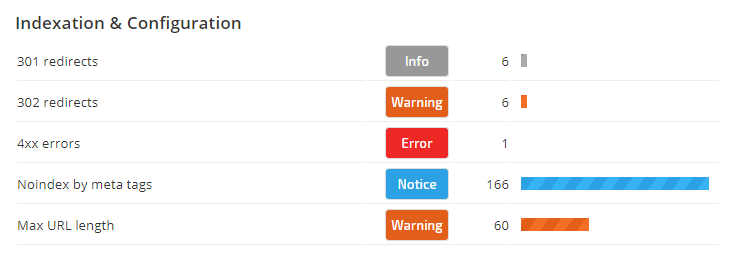
In this section, the status of potential performance issues is reported. Clicking any of the items listed launches the Pages report filtered for that issue.
HTTP Status Codes & Crawl Depth
Hover over the sections of the pie chart to view the number associated with the HTTP Status Codes and Pages Crawl Depth. If maximum HTML size warnings exist, a notification displays below the charts.
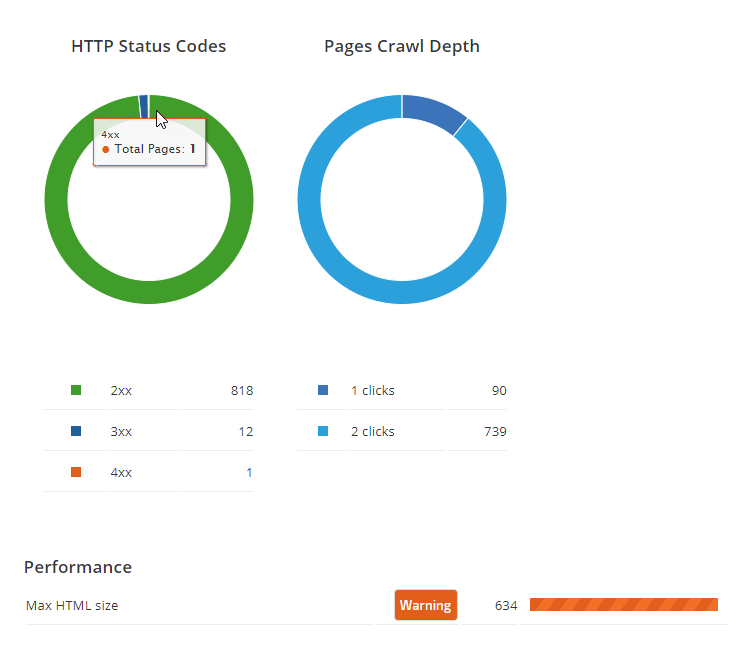
Hover over the sections of the pie chart to view the number associated with the HTTP Status Codes and Pages Crawl Depth. If maximum HTML size warnings exist, a notification displays below the charts.
Status of Link Types
Issues such as broken internal links, internal links with nofollow, a large number of external links, or an overall high link total are reported in this section.
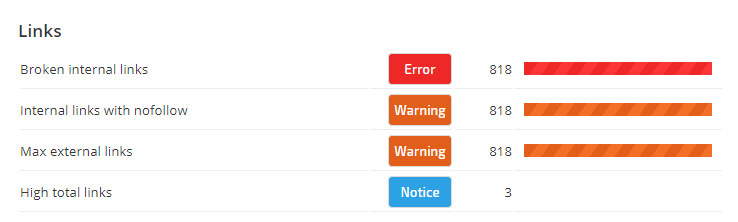
Issues such as broken internal links, internal links with nofollow, a large number of external links, or an overall high link total are reported in this section.
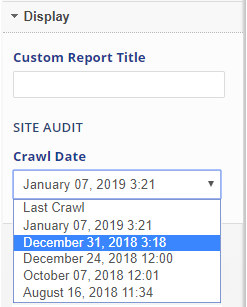 |
Display
|
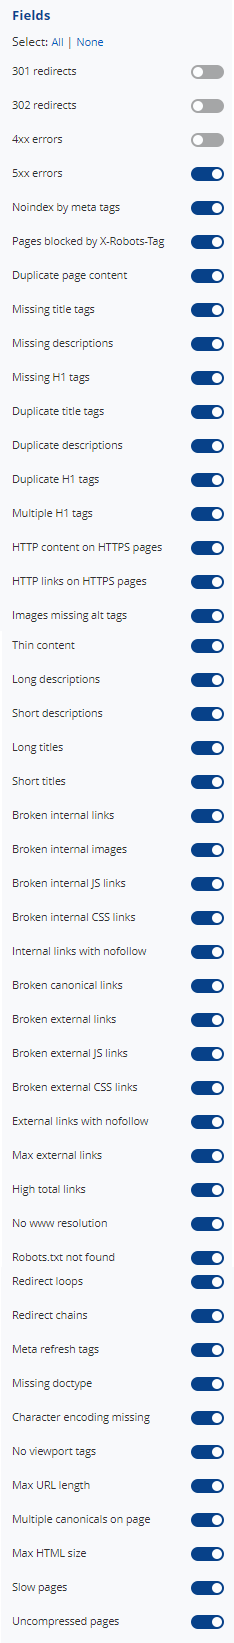 |
Fields
|
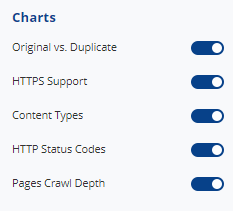 |
Charts
|
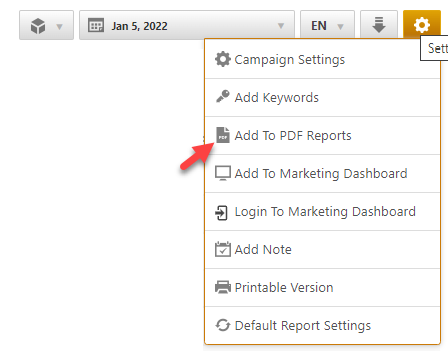
Add to PDF Report
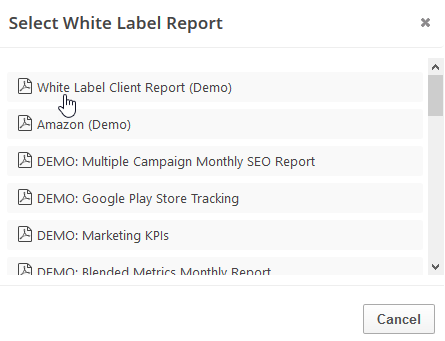
Conveniently add a report or graph with its current settings to a PDF report by hovering over the gold gear icon and selecting Add to PDF Reports
Select the PDF Report that you want the report or graph added to
Drag the new report or graph into the position you want it to display in the PDF and confirm that the Date settings do not conflict with the automated scheduling settings.
Add to Marketing Dashboard
Conveniently add a report or graph with its current settings to a marketing dashboard:
1. Hover over the gold gear icon and select Add to Marketing Dashboard
2. Select the Dashboard (campaign name)
3. Select the Dashboard Page that you want the report added to

1. Hover over the gold gear icon and select Add to Marketing Dashboard
2. Select the Dashboard (campaign name)
3. Select the Dashboard Page that you want the report added to
4. Click the "Go to Dashboard" link to further customize the report (e.g., drag it to a specific position on the page, change date settings, etc.)

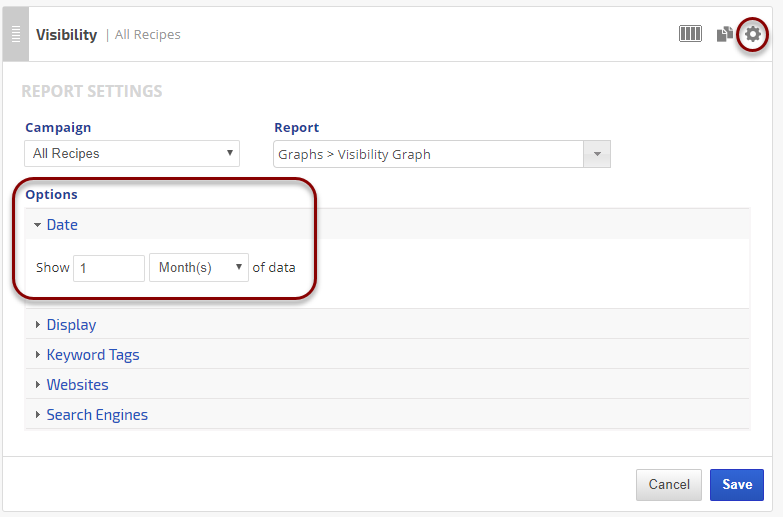
Refer to the Report Options section for details regarding the display settings, filters and sort options available for this report.
The report date (or date range) is governed by the selected Dashboard date option: Date Selection or Fixed Periods, learn more...
- Daily reports default to the last day of the selected period
- Weekly and monthly reports default to 1 month of data
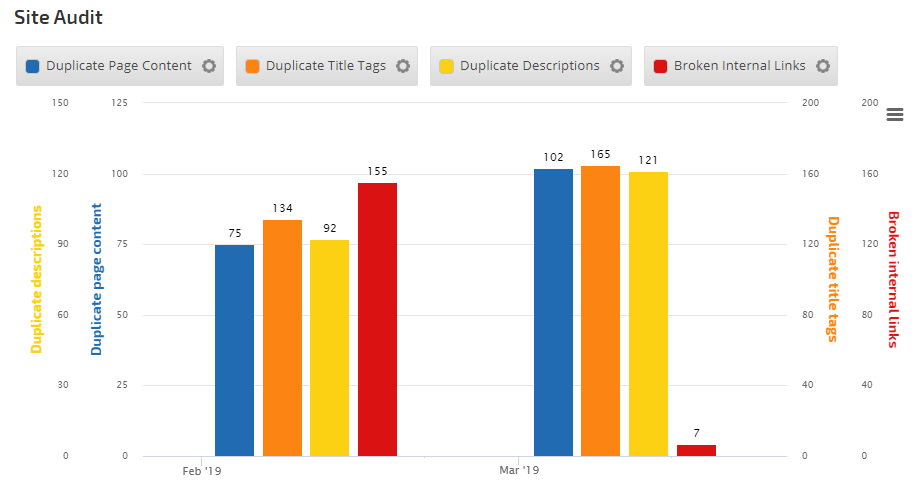
Site Audit Insight Graph
Data from Site Audits and Site Audit Comparisons can be added to Insight Graphs for viewing progress.
Add a Metric
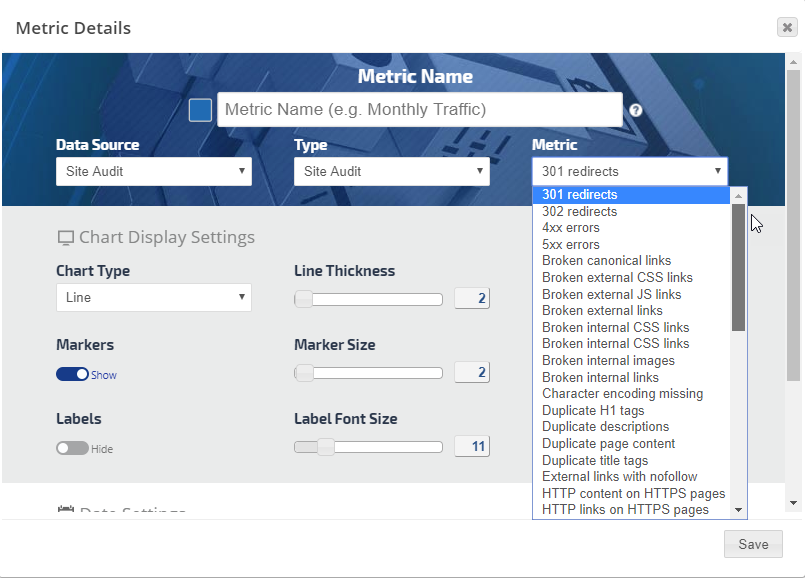
- In the Data Source menu select Site Audit
- In the Metric menu select one of the available Site Audit metrics
- Add the Metric Name, select a color and the chart display settings you want and click the Save button
Site Audit Insight Graph example