Share of Voice (SOV) is a measure of the exposure the brand gets compared to the competitors. The exposure measured in our SOV report is using Search Visibility Metrics. The Visibility percentage is distributed between the primary domain and the tracked competitor domains, which totals to be 100%.
The report also includes, Visibility Graph, Competitors chart, Tags chart, and Landing Pages tracked for the primary domain for the last date from the specified date range, lists 10 Top Organic competitors and their SOV metric, and a graph for the number of Keywords ranking at the top 10 positions for the Top 10 Organic competitors.
In order for the SOV report to show all the data in all sections, it is required to have competitors' domains be listed in Campaigns > Websites and tags to be assigned to the keywords in the Campaigns > Keywords.
- SEO
- Rank Tracker
- Local SEO
- Mobile SEO
- Link Manager
- Landing Pages
- Social Signals
- On-Page Optimization
- Enterprise SEO Solutions
- Marketing
- Competition Analysis
- Insight Graph
- Keyword Research
- Graphs & Widgets
- Market Reach
- Marketing KPI
- Brand Visibility
- White Label SEO
- Marketing Dashboard
- Client Dashboard
- PDF Reports
- PDF Templates
- Other
- Email Notifications
- Portfolio Management
- Integrations
- Google Analytics
- Search Console
- Pay Per Click
- WeDevelop
- API
Share of Voice
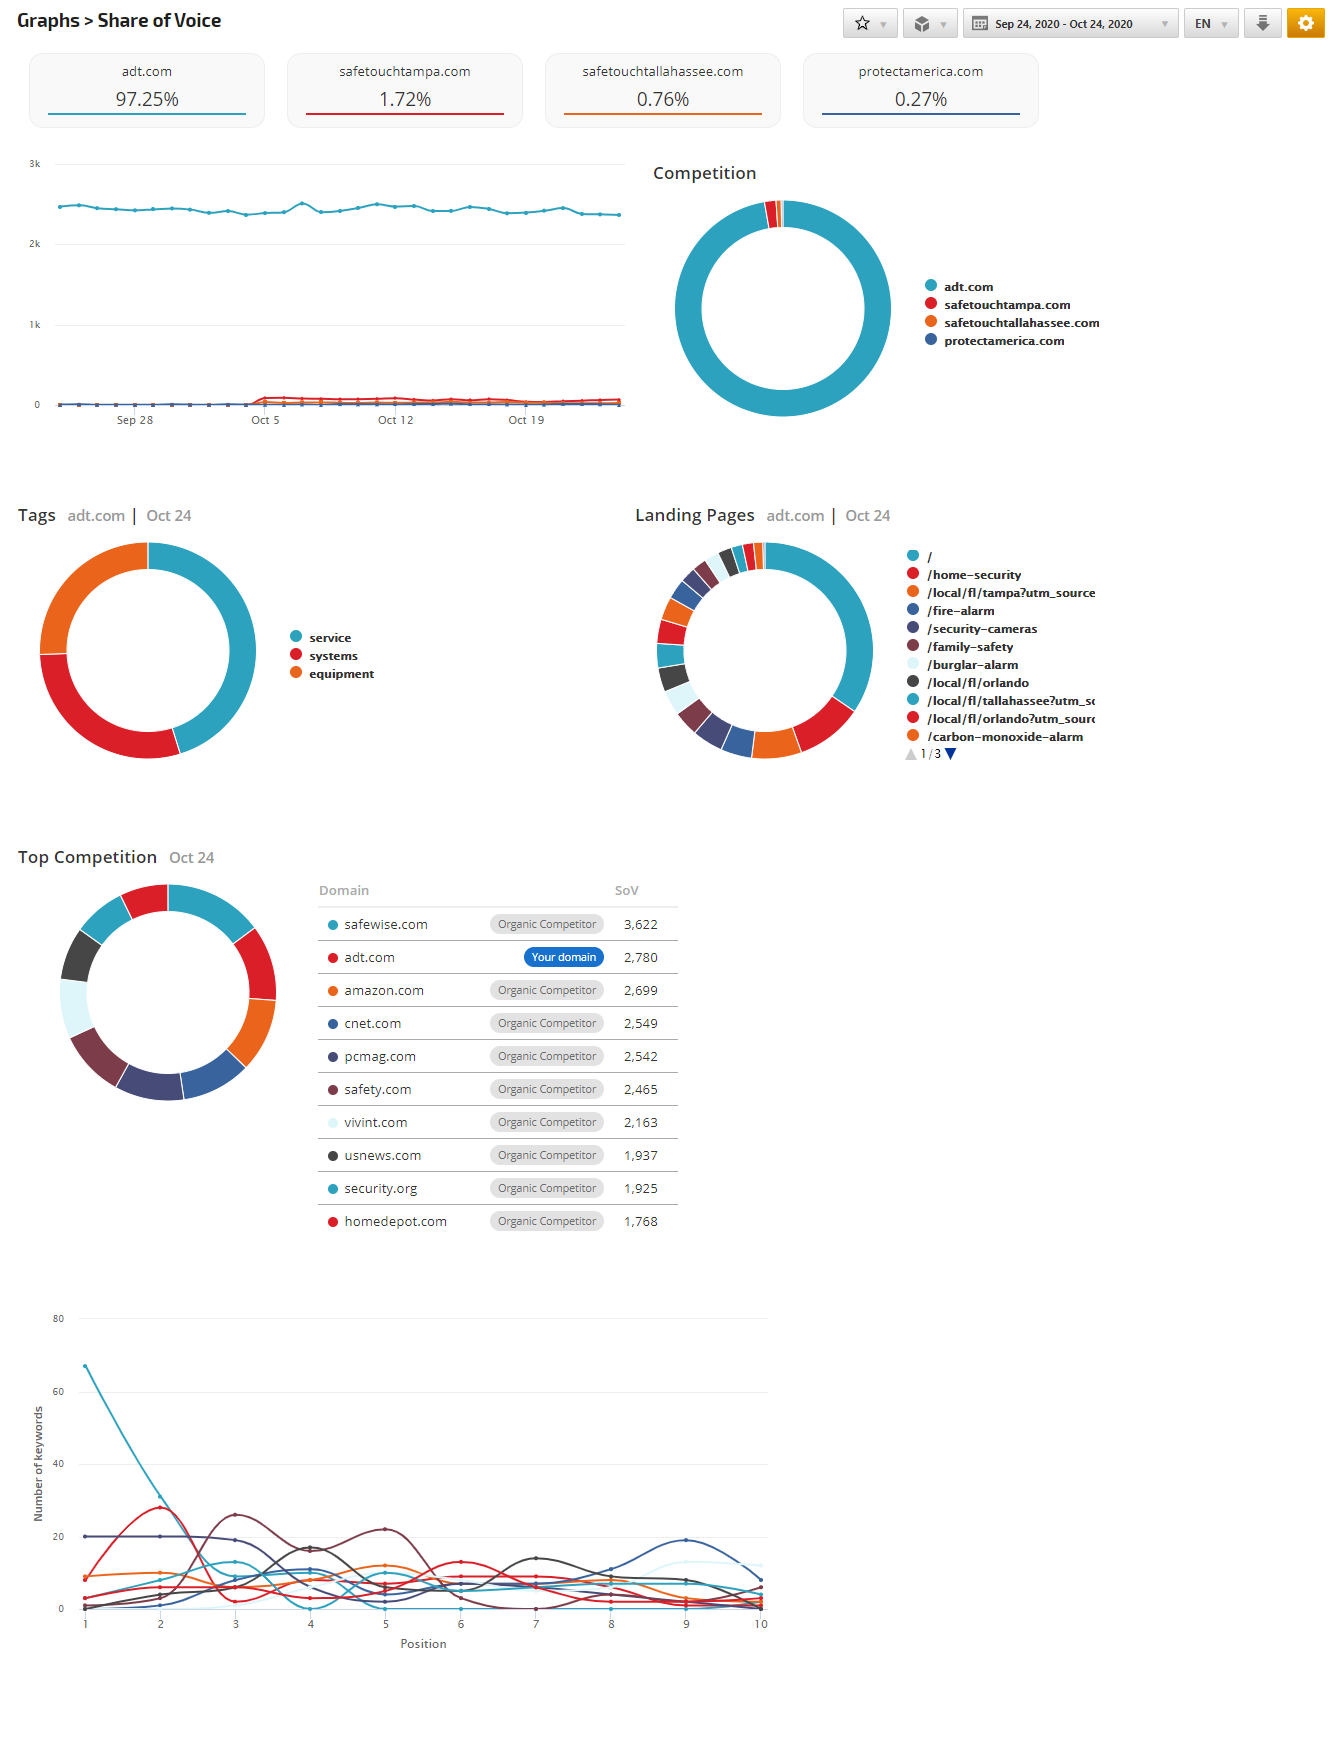
Located in Reports > Organic Search > Competitor Analysis
Visibility Share is an exposure divided between competitors and the primary domain based on the visibility parentage metric totaling 100%. In this section, the competitors who are listed in Campaigns > Websites in Campaign Settings whose data is collected by a RankBot crawl. If you add a new competitor website the SOV report will not display Visibility metric data for that newly added campaign until the next crawl is performed.

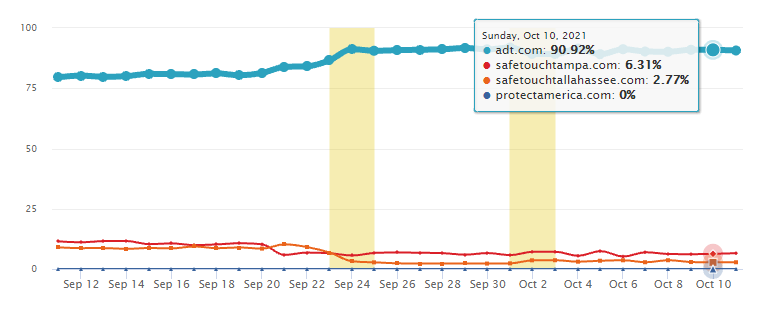
The Visibility Graph displays the Visibility Score for the primary domain and its competitors for the given date range. Hover over to see the data for the list of domains with their corresponding Visibility Score for each tracked date from the set date range. The primary domain has a more prominent line.
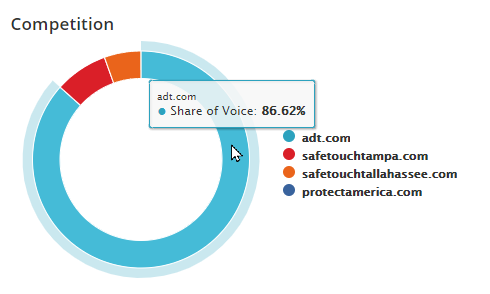
The Competition Chart shows a total of the above data in the chart for the set date range. Hover over each section of the chart with their corresponding colors to see the total data. Domain data disappears on the graph and on the chart when clicked on the domain name next to the chart and appears if clicked again.
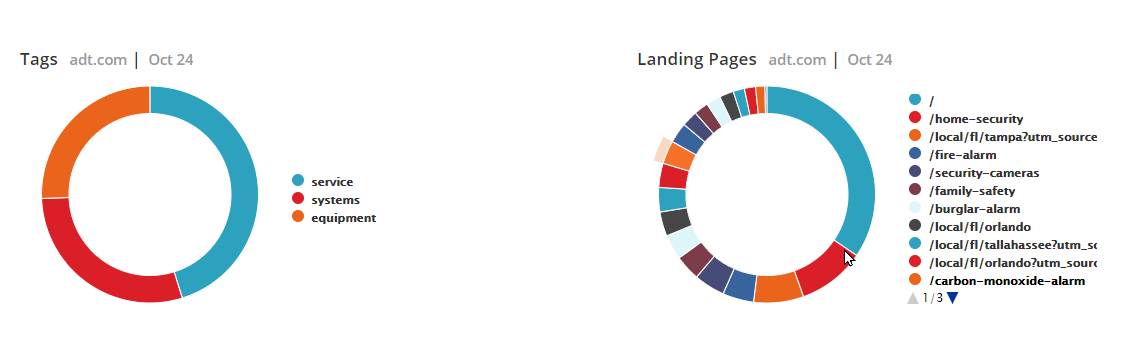
The Tags Chart displays a Share of Voice metric for every tag assigned to the tracked list of keywords in the Campaign Settings > Keywords. There will be no data displayed if tags are not assigned to the tracked keywords. The Tags Chart and Landing Pages' data is displayed for the primary domain for the last date of the date range set in this report. The list of Landing pages is paginated and the next or previous pagination is accessed by clicking the arrow down or up.
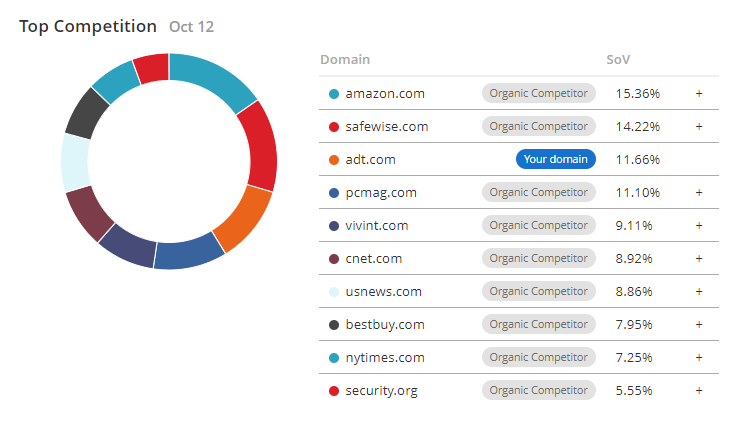
The Top Competition Chart and List are for the top 10 Organic Competitors including primary domain and track domain if they fall into the top 10 Organic Competitors list. The data is collected from the historical trend of the last snapshot of websites whose keywords had scored for the top positions with their SoV (Visibility Score) values.
There is an option to add the listed Organic domains from this report into the Campaign's Competitor domains (Campaigns > Websites) by clicking on the + sign next to the SoV of each domain. Note: If you have reached the campaign limit of a number of Competitor domains, then no domains can be added from this screen.
There is an option to add the listed Organic domains from this report into the Campaign's Competitor domains (Campaigns > Websites) by clicking on the + sign next to the SoV of each domain. Note: If you have reached the campaign limit of a number of Competitor domains, then no domains can be added from this screen.
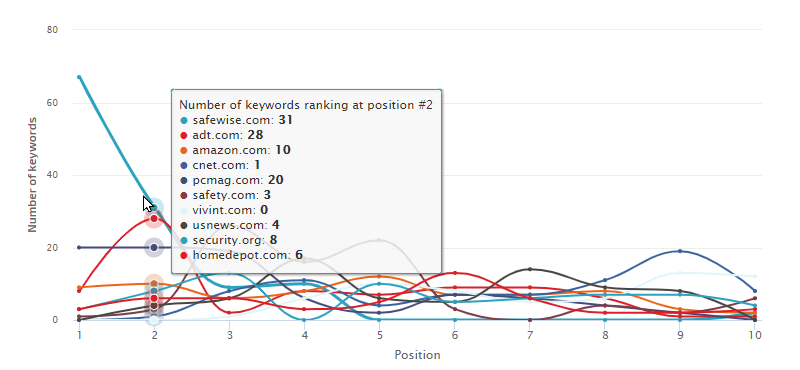
The Top Competition Graph provides the number of keywords ranking at the top 10 positions for the top 10 Organic Competitors.
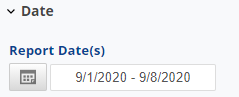 |
Date
|
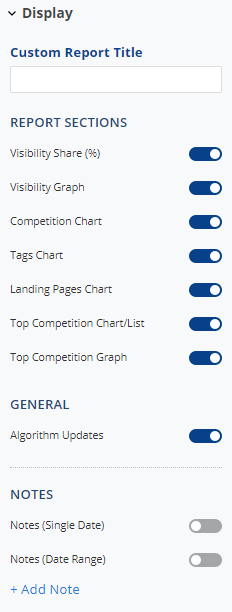 |
Display
|
 |
Widget Settings
|
 |
Keyword Tags
|
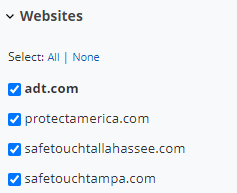 |
Websites
|
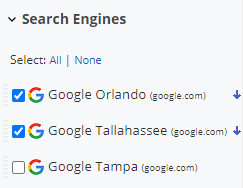 |
Search Engines
|
 |
Click the Apply Changes button |