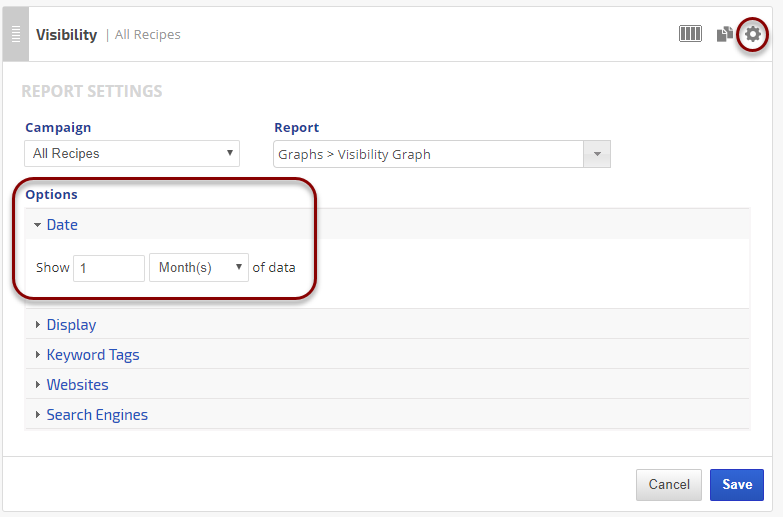
This Google Ads Campaigns report features a trend graph that can be set to display your choice of key metric. To create a graph with more than one metric, we recommend setting the graph in this report to be hidden, and using the Insight Graph in your white label reports. An Ad Metrics table can be customized to display any of the Ads metrics in your Ads account that Google makes available for integration.
Integration directly with a Google Ads account is required for this report, learn how with the Google Ads Connection Tool...
- SEO
- Rank Tracker
- Local SEO
- Mobile SEO
- Link Manager
- Landing Pages
- Social Signals
- On-Page Optimization
- Enterprise SEO Solutions
- Marketing
- Competition Analysis
- Insight Graph
- Keyword Research
- Graphs & Widgets
- Market Reach
- Marketing KPI
- Brand Visibility
- White Label SEO
- Marketing Dashboard
- Client Dashboard
- PDF Reports
- PDF Templates
- Other
- Email Notifications
- Portfolio Management
- Integrations
- Google Analytics
- Search Console
- Pay Per Click
- WeDevelop
- API
Documentation
> Paid Search >
Google Ads
Google Ads Campaigns Report
Google Ads Campaigns example
Report Options
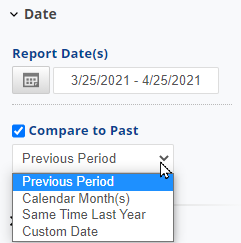 |
Date
|
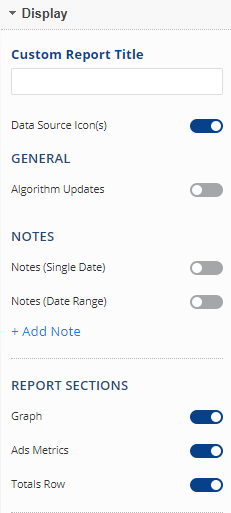 |
Display
|
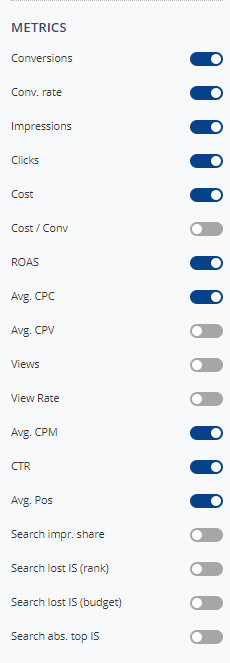 |
MetricsDisplay or Hide these Metric columns:
|
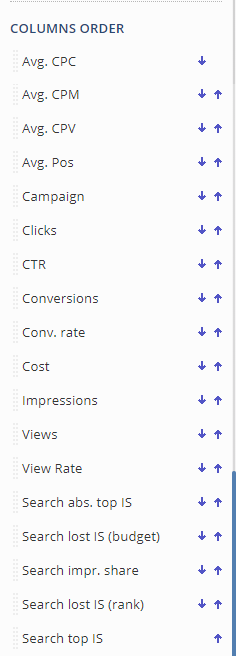 |
Column OrderTo change the display order of metric columns, drag and drop them into the desired order.
|
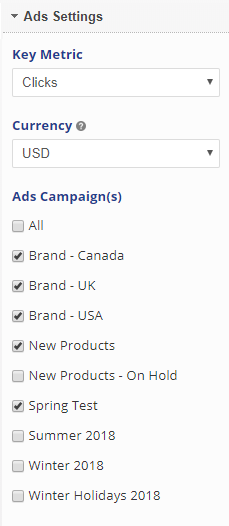 |
Ad Settings
|
Google Ads Metrics
Ads performance data directly from the Google Ads API* can be viewed in the Google Ads Campaigns report, Insight Graphs, Single Metric Widgets, which can be displayed in branded Marketing Dashboards, Client Dashboards, and scheduled PDF Reports.
* Refer to integration instructions
Metric Options
- Avg CPC: The average cost per click
- Avg CPM: The average cost per thousand
- Avg CPV: The average cost per view
- Clicks: The number of times a link was clicked
- Conversions: The number of conversions for all conversion actions that you have opted into optimization.
- Conversion Rate: The number of conversions divided by total clicks that can be tracked to conversions.
- Cost: The sum of your cost-per-click (CPC) and cost-per-thousand impressions (CPM) costs during this period.
- CTR: The number of clicks your ad receives (Clicks) divided by the number of times your ad is shown (Impressions).
- Impressions: Count of how often your ad has appeared on a search results page or website on the Google Network.
- Search Absolute Top Impression Share: The impressions you've received in the absolute top location (the very first ad above the organic search results) divided by the estimated number of impressions you were eligible to receive in the top location.
- Search Budget Lost Impression Share: The estimated percent of times that your ad was eligible to show on the Search Network but didn't because your budget was too low.
- Search Impression Share: The impressions you've received on the Search Network divided by the estimated number of impressions you were eligible to receive.
- Search Rank Lost Impression Share: The estimated percentage of impressions on the Search Network that your ads didn't receive due to poor Ad Rank.
- Search Top Impression Share: The impressions you've received in the top location (anywhere above the organic search results) compared to the estimated number of impressions you were eligible to receive in the top location.
- Views: The number of times your ads were viewed.
Learn more... about Google Ads metrics.
Add to PDF Report
Conveniently add a report or graph with its current settings to a PDF report by hovering over the gold gear icon and selecting Add to PDF Reports
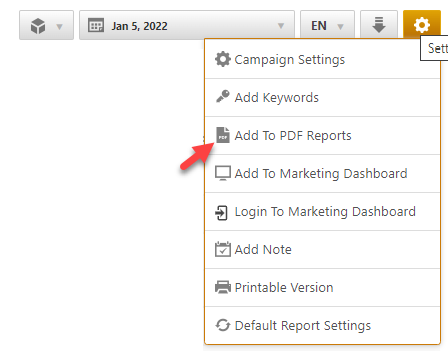

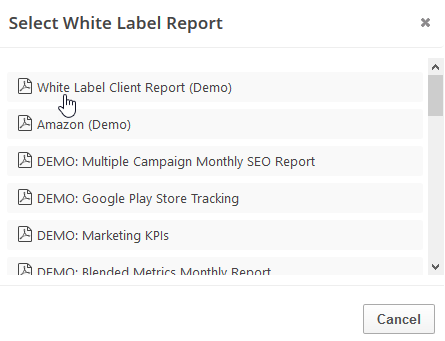
Select the PDF Report that you want the report or graph added to
Drag the new report or graph into the position you want it to display in the PDF and confirm that the Date settings do not conflict with the automated scheduling settings.
Add to Marketing Dashboard
Conveniently add a report or graph with its current settings to a marketing dashboard:
1. Hover over the gold gear icon and select Add to Marketing Dashboard
2. Select the Dashboard (campaign name)
3. Select the Dashboard Page that you want the report added to
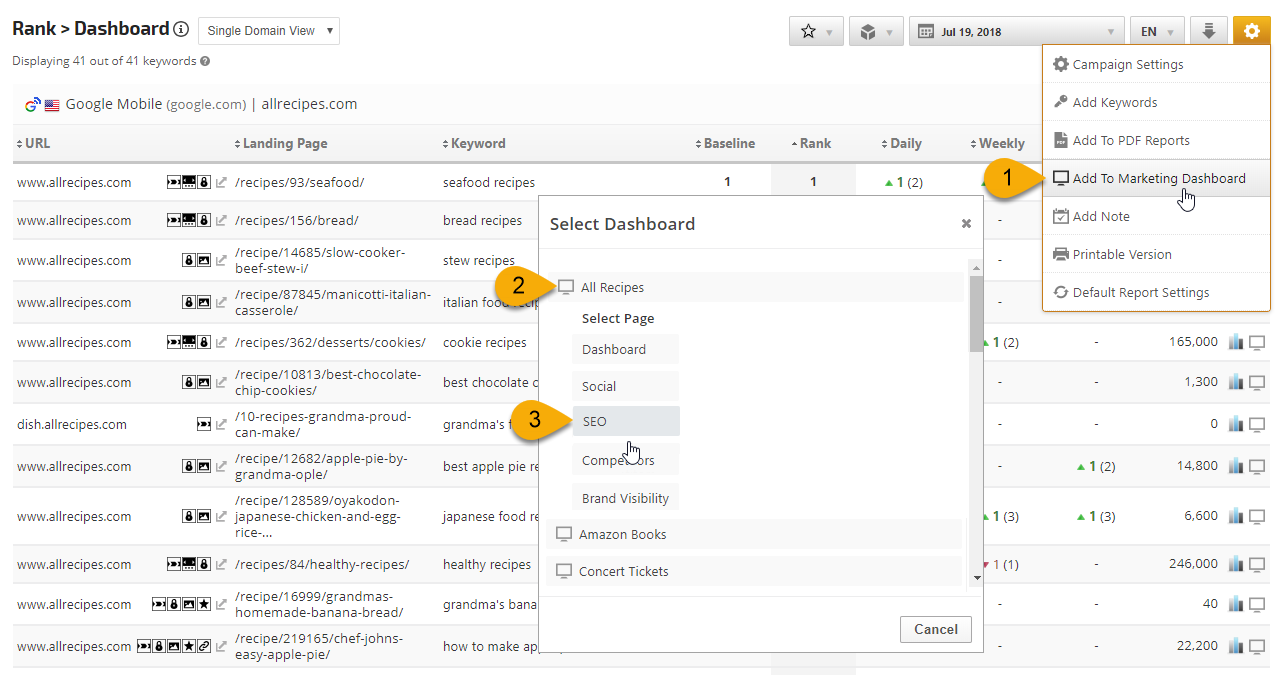
1. Hover over the gold gear icon and select Add to Marketing Dashboard
2. Select the Dashboard (campaign name)
3. Select the Dashboard Page that you want the report added to

4. Click the "Go to Dashboard" link to further customize the report (e.g., drag it to a specific position on the page, change date settings, etc.)
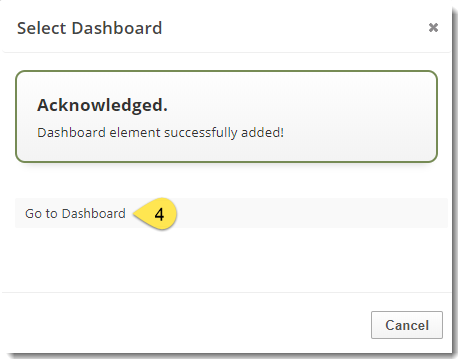
Refer to the Report Options section for details regarding the display settings, filters and sort options available for this report.
The report date (or date range) is governed by the selected Dashboard date option: Date Selection or Fixed Periods, learn more...
- Daily reports default to the last day of the selected period
- Weekly and monthly reports default to 1 month of data


