After you've created your first campaign, the first screen you'll see when logging into Rank Ranger provides a convenient view of all of the Campaigns in your account. This screen can be customized to display campaign data in the format each individual account user prefers.
Data displayed on this account campaigns summary screen is updated weekly on Mondays and can be manually refreshed using the Last Update option.
Campaign Keyword Limit
There is a maximum limit of 1000 keywords per campaign in order to ensure efficient report generation and convenient viewing of these screens. Adding more than 1000 keywords to a campaign will cause some functionality to be disabled.
Video: How to Customize the Campaigns Screen
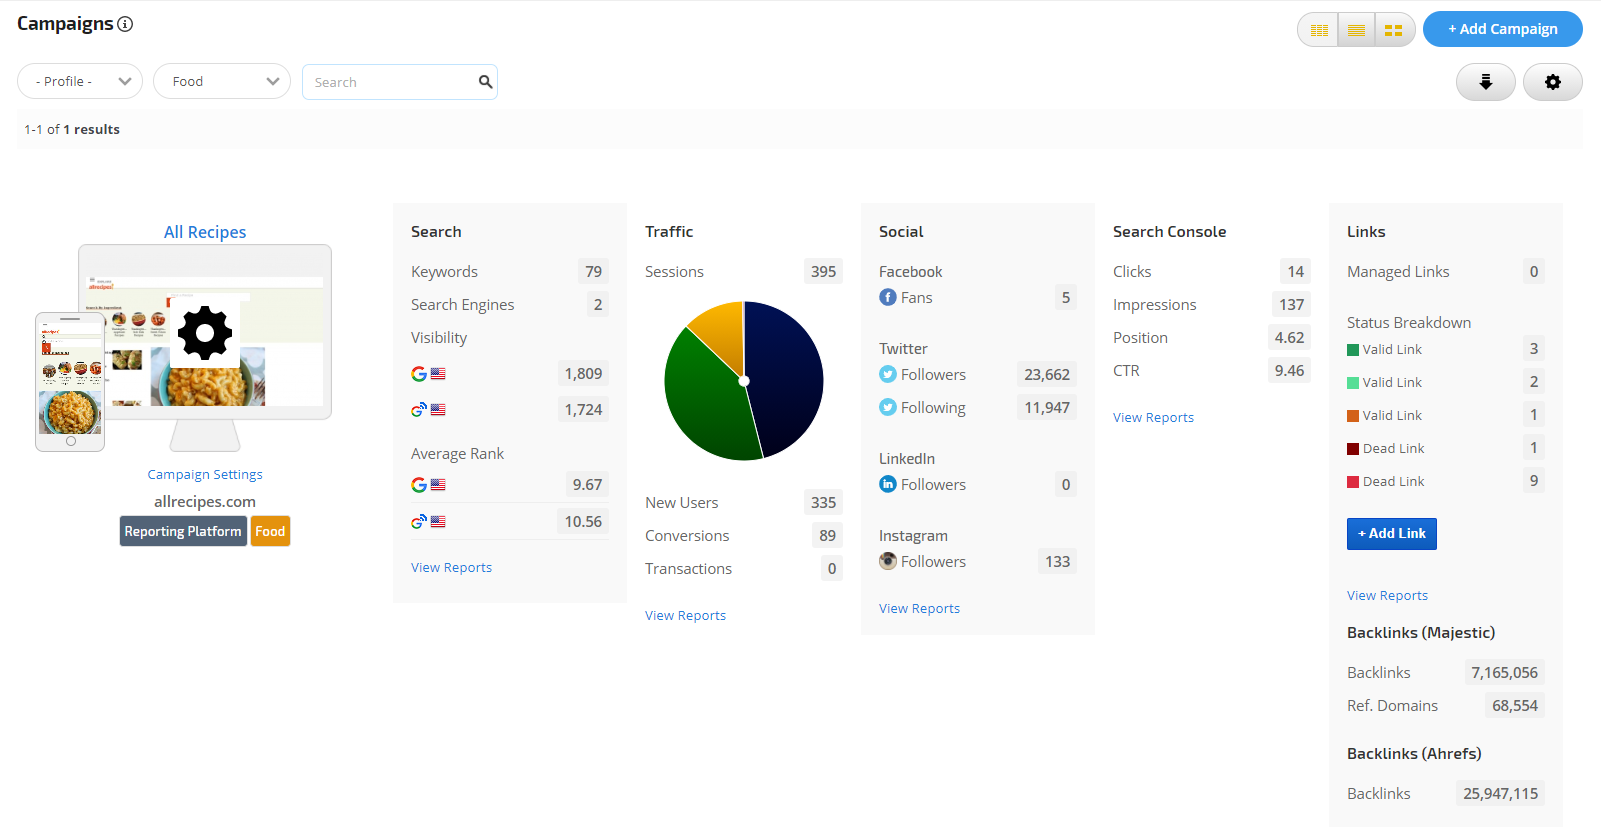
Campaign Pro View
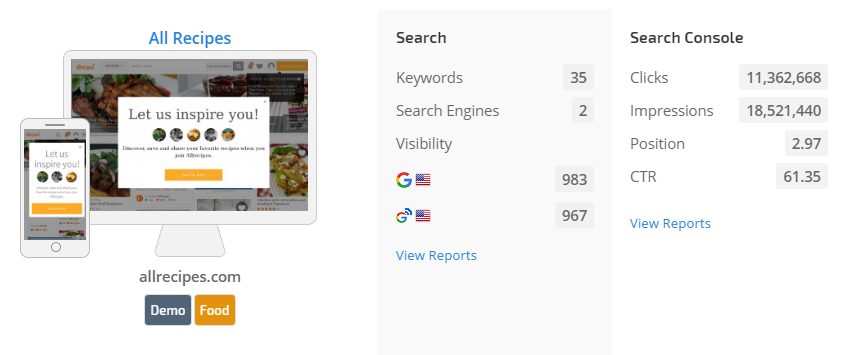
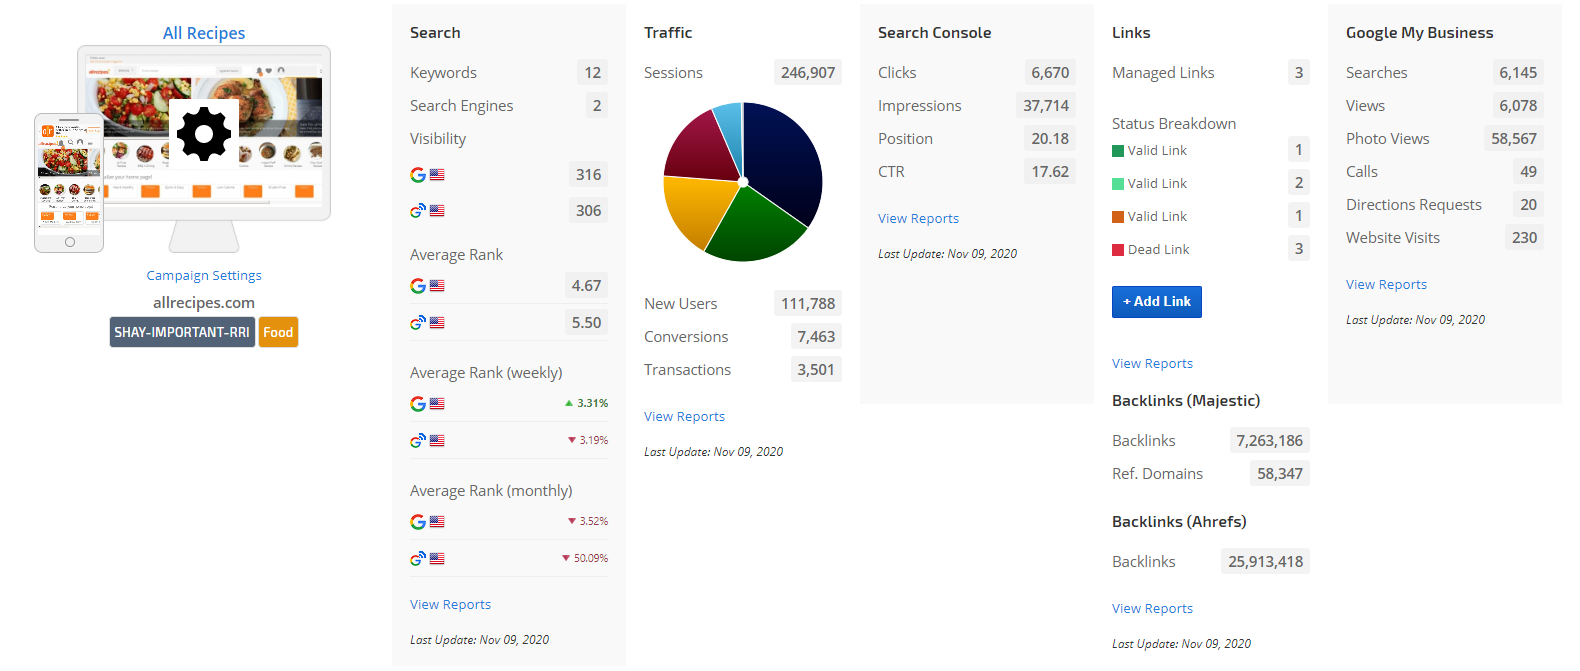
Campaigns Pro View Screenshot
Pro View consists of the following columns: Screenshot of the site with campaign settings, Search, Traffic, Search Console and Links details breakdown.
Campaign Details & Display Settings
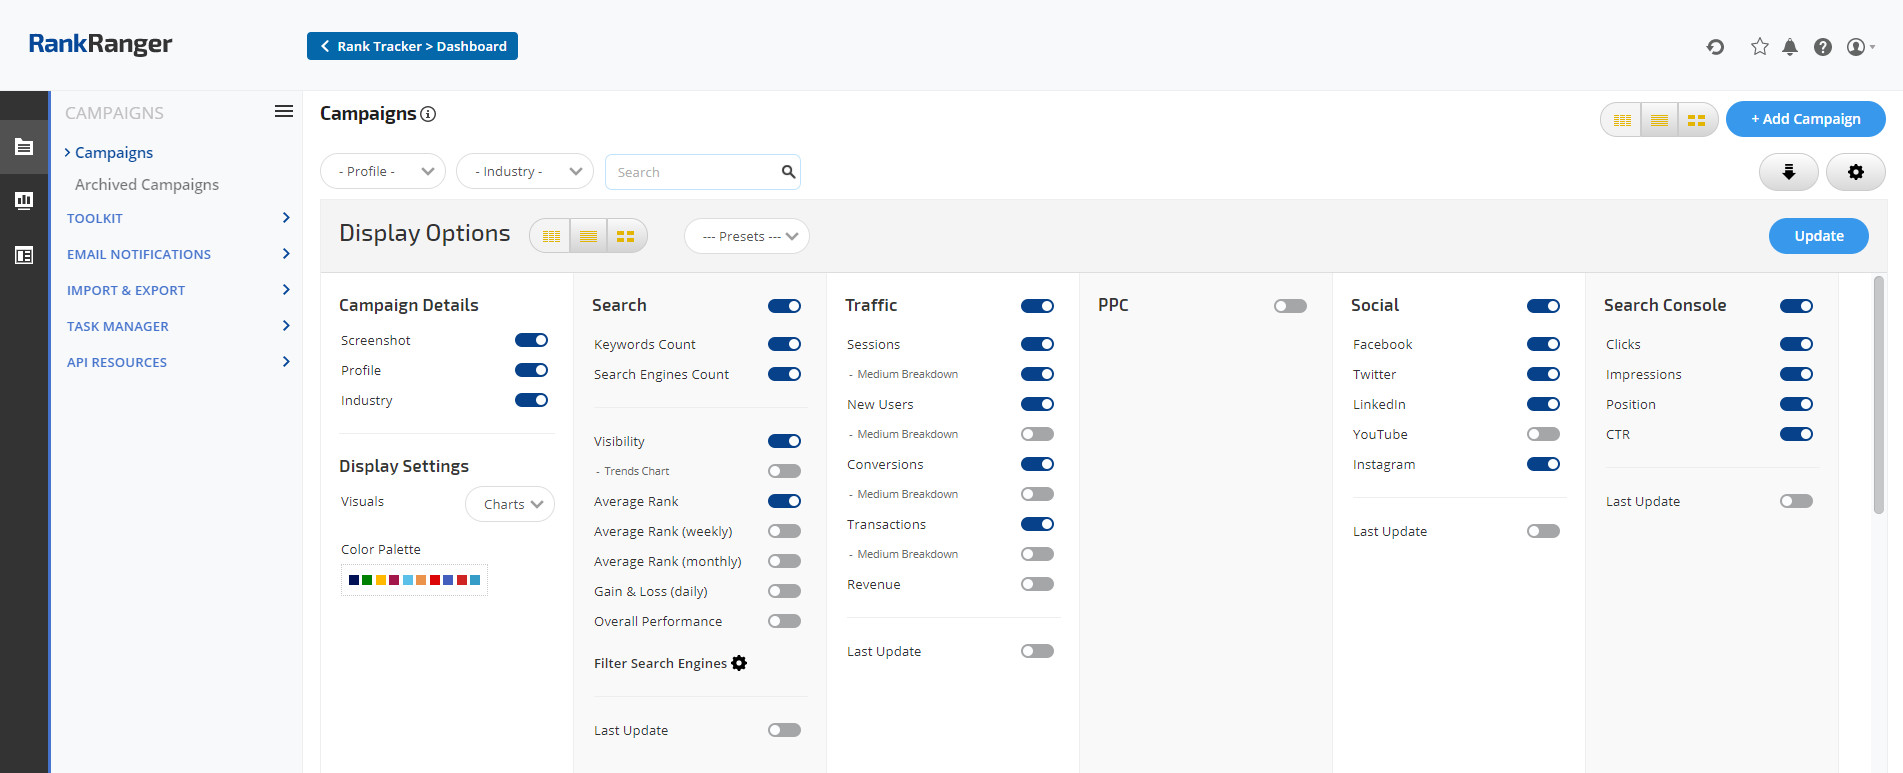
Campaigns Pro View Display Options
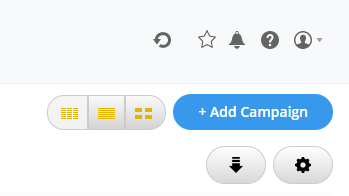
To add a new campaign to your account, click the + Add Campaign button.
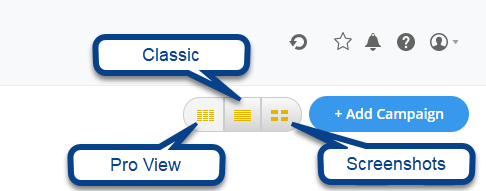
To open the Display Options, click the Display Settings button in the upper right area of the screen and select the Pro layout to open the Display Options.
Fig. 2. Add Campaign and Display Settings buttons
Each marketing metric can be turned on or off by clicking the toggle button.
Fig. 3. Account Campaigns Pro View Display Options
Campaign Details
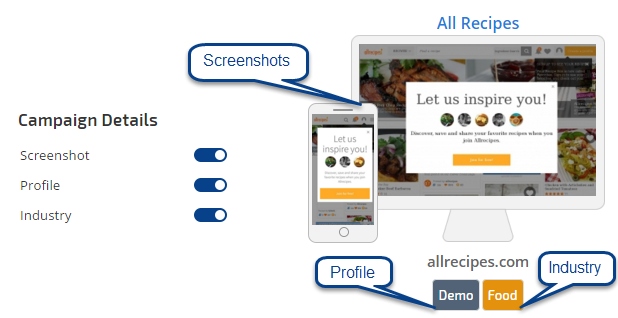
Select the Campaign Details you want to be displayed:
Screenshot: the desktop and mobile screenshot of the primary domain
Profile: if the campaign is associated with a Profile, it displays below the screenshot
Industry: if an industry was set for the campaign, then it will display below the screenshot Profiles and Industries are found in the Advanced Settings section of the Campaign General Settings screen.
Fig. 4. Visual description of Campaign Details settings
Visual Display Settings
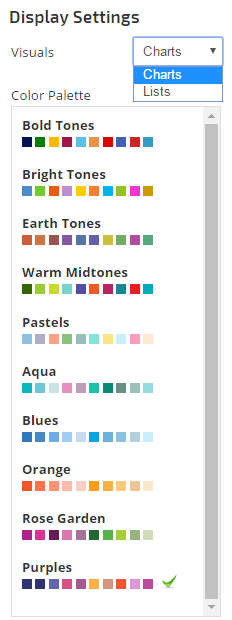
Select visual settings of Charts or Lists and a Color Palette.
Fig. 5. Visual Display settings: Charts, Lists, and Colors
Search Metrics Settings
Search Keywords, Search Engines, and Visibility Graphs
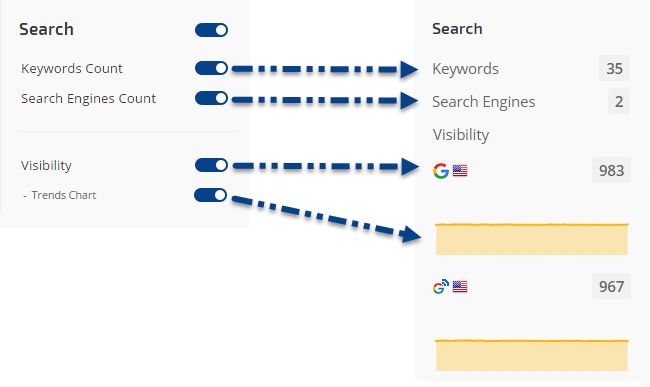
Search metrics are updated daily. Select the search metrics you want to be displayed:
Keywords Count: the number of keywords tracked in the campaign.
Search Engines: the number of search engines the keywords are being tracked on.
Visibility Score: is calculated per keyword for keywords that are ranking in the top 30 search engine results for each search engine tracked in the campaign (learn more about Visibility Score calculation).
Visibility Trends Chart: provides Visibility Score trend for the past 30 days.
Fig. 6. Keywords & Search Engines Count, and Visibility Score and Trends chart
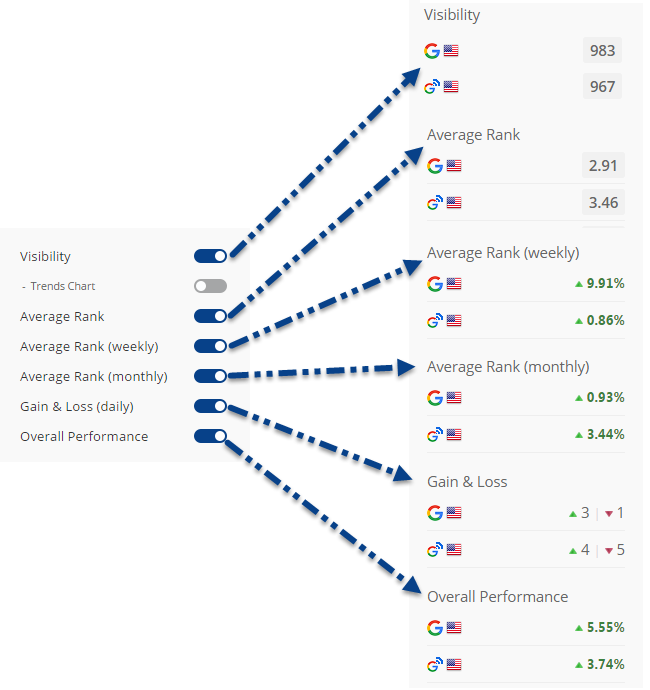
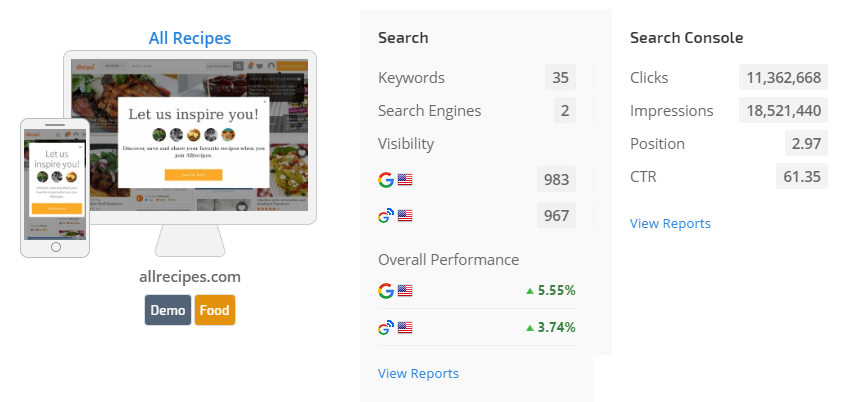
Visibility, Average Rank, Gain & Loss, and Overall Rank Performance
Toggle on the rank metrics you want to be displayed:
Visibility: is calculated per keyword for keywords that are ranking in the top 30 search engine results for each search engine tracked in the campaign (learn more about Visibility Score calculation).
Visibility Trends Chart: provides Visibility Score trend for the past 30 days.
Average Rank: the average rank for the current day.
Average Rank (weekly): the average rank for the past 7 days.
Average Rank (monthly): the average rank for the past 30 days.
Gain & Loss (daily): green upward arrow represents the number of keywords that increased in rank since the previous day, and the red downward arrow represents the number of keywords that decreased in rank since the previous day.
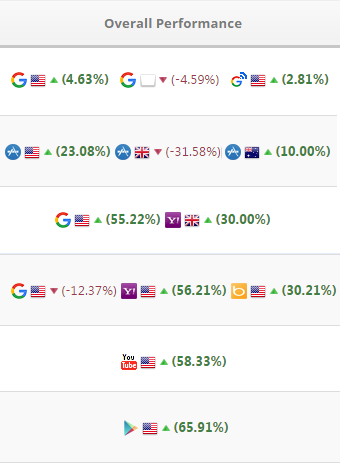
Overall Performance: the overall keyword performance change within the campaign from the first day that you added the keywords (Day 1) vs. the current day (Today). We check and compare only the keywords that are ranked on both Day 1 & Today - and that rank at least in the top 100 search engine results. If a keyword didn't rank at all we can't consider it because we can't calculate it.
Fig. 7. Rank Metrics with display example
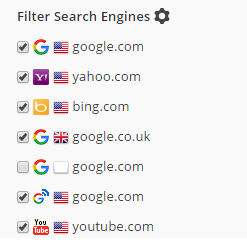
Filter Search Engines
To exclude the display of specific search engines, click to remove the checkmark in the corresponding check box.
Fig. 8. Filter Search Engines settings
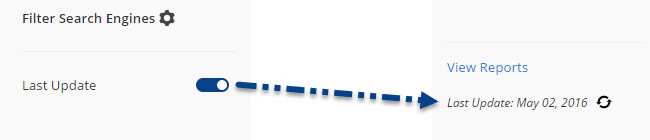
Last Update
Campaign summary data is refreshed weekly for Campaigns Pro View.
For daily rank updates, full search engine rank tracking reports can be quickly accessed by clicking the View Reports link at the bottom of the Search metrics.
Toggle on the Last Update option to display the date that the selected metrics were updated. Hover over the area following the date to enable the refresh icon and click it to obtain the latest data available for each data type (e.g., rank and traffic can be updated daily, links are tracked weekly).
Fig. 9. Last Update display setting
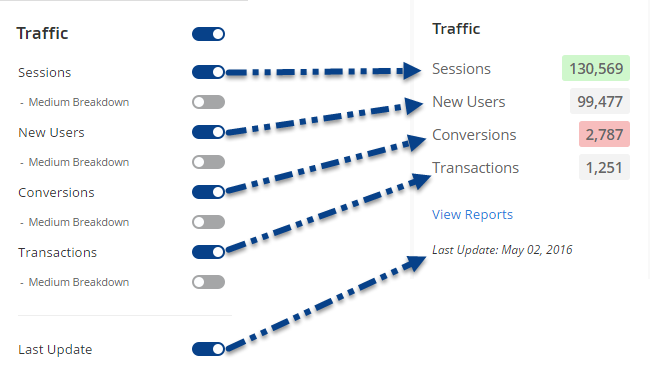
Traffic Metrics Settings
Traffic Sessions, New Users, Conversions, and Transactions
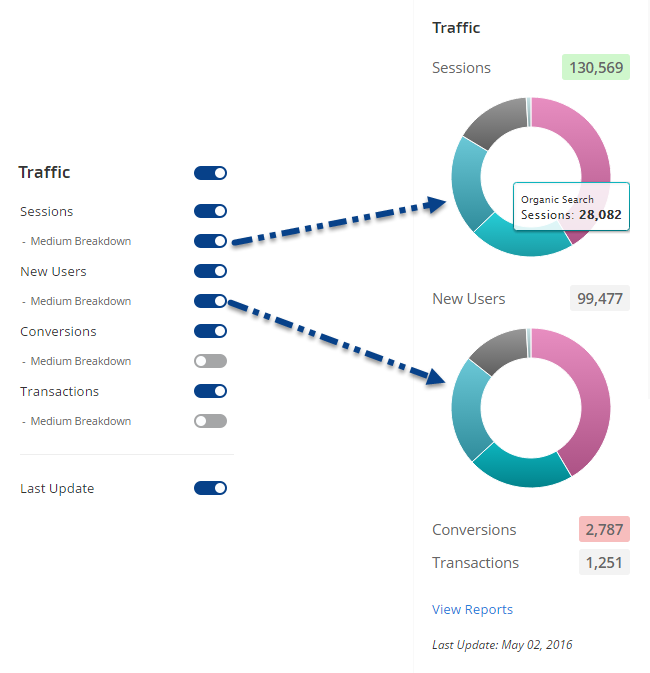
Select the Traffic metrics you want to be displayed:
Sessions:the number of visitor sessions that have taken place on the tracked website during the past 30 days.
Sessions Medium Breakdown: pie chart or list graphs of Sessions by Direct, Paid Search, Email, Organic Search, Referral, Social or Other traffic medium.
New Users: the number of first-time visitors to the tracked website during the past 30 days.
New Users Medium Breakdown: pie chart or list graphs of New Users by Direct, Paid Search, Email, Organic Search, Referral, Social, or Other traffic medium.
Conversions: the number of completed goal conversions for the tracked website during the past 30 days. (requires Goals to be set up in Google Analytics).
Conversions Medium Breakdown: pie chart or list graphs of Conversions by Direct, Paid Search, Email, Organic Search, Referral, Social or Other traffic medium.
Transactions: the number of eCommerce transactions completed during the past 30 days (requires Ecommerce Tracking set up in Google Analytics).
Transactions Medium Breakdown: pie chart or list graphs of Transactions by Direct, Paid Search, Email, Organic Search, Referral, Social or Other traffic medium.
Last Update: Analytics data is refreshed every Monday for this screen in order to provide data at the beginning of most people's workweek, if you enable the Last Update option then the date will display along with a hover-over option to refresh the data when needed during the week. Daily traffic data is available in our Google Analytics reports which can be quickly accessed by clicking the View Reports link at the bottom of the Traffic section on the Campaigns Pro View screen.
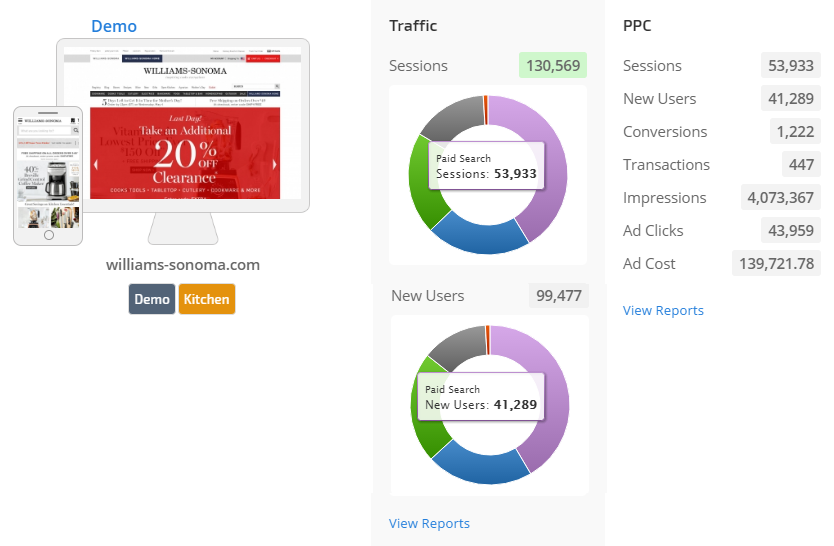
Fig. 10. Traffic settings with display example
Traffic Medium Breakdown
If you enable the Medium Breakdown option for any traffic metric, then data will be presented in a Pie Chart or List format (depending upon the Visual settings selected) for the applicable traffic medium (e.g., Direct, Paid Search, Email, Organic Search, Referral, Social or Other).
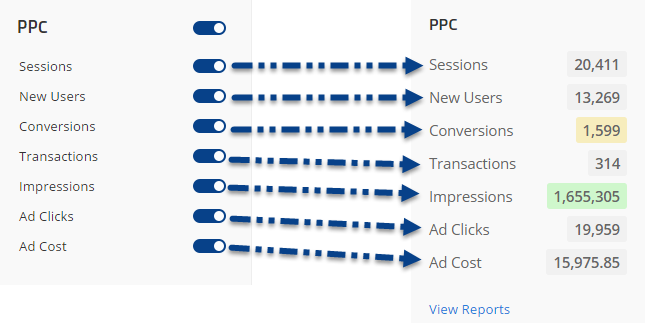
Sessions: the number of visitor sessions to the tracked website or app that originated from an Ad Click during the past 30 days.
New Users: the number of first-time visitors to the tracked website or app that originated from an Ad Click during the past 30 days.
Conversions: the number of completed conversions (e.g., the user clicks your AdWords ad link and completes the action that is defined for the ad campaign in Google AdWords).
Transactions: the number of transactions completed on the tracked website or app that originated from an Ad Click during the past 30 days.
Impressions: the number of times your ads have been shown on a search result page during the past 30 days.
Ad Clicks: the number of times users clicked on your AdWords ads during the past 30 days.
Ad Cost: the total cost of AdWords ads during the past 30 days.
PPC data is refreshed on this screen every Monday along with Google Analytics.
Fig. 12. PPC Metrics settings and an example of how they display
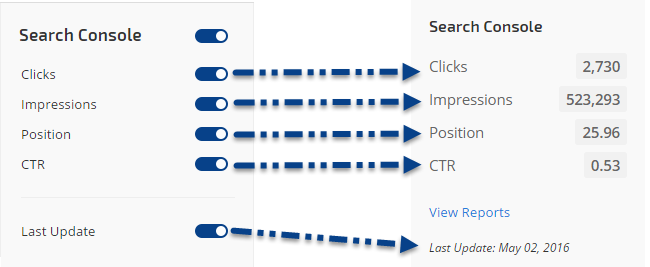
Select the Search Console Metrics you want to be displayed:
Clicks: the number of clicks from the Google search results page that landed the user on the tracked website.
Impressions: the number of links to your site that are displayed as a result of a user query in Google search results on a page that the user viewed (does not require the user to scroll to the link).
Position: the average position of the topmost result from your site (more information).
CTR (Click-Through-Rate): the number of clicks divided by the number of impressions.
Last Update: Search Console data is refreshed every Monday for this screen in order to provide data at the beginning of most people's workweek, if you enable the Last Update option then the date will display along with a hover-over option to refresh the data when needed during the week. Please be advised that there can be a delay of up to 5 days between the time Google compiles this data and releases it via their API to our platform.
Fig. 14. Search Analytics metrics options with an example display.
Link Metrics Settings
Managed Links and Backlinks
Select the Link Metrics you want displayed:
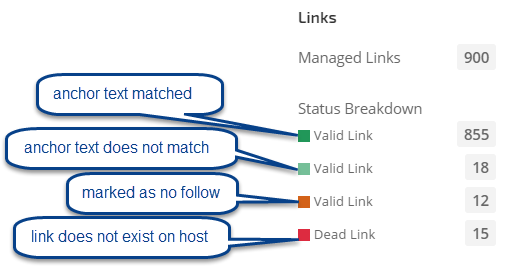
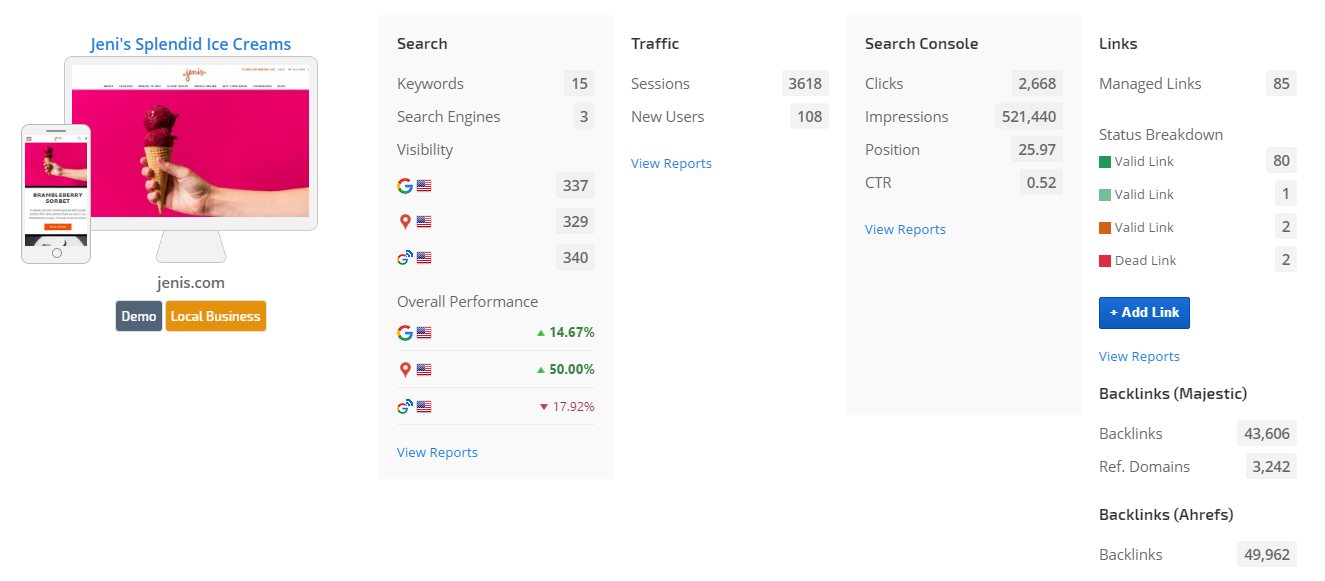
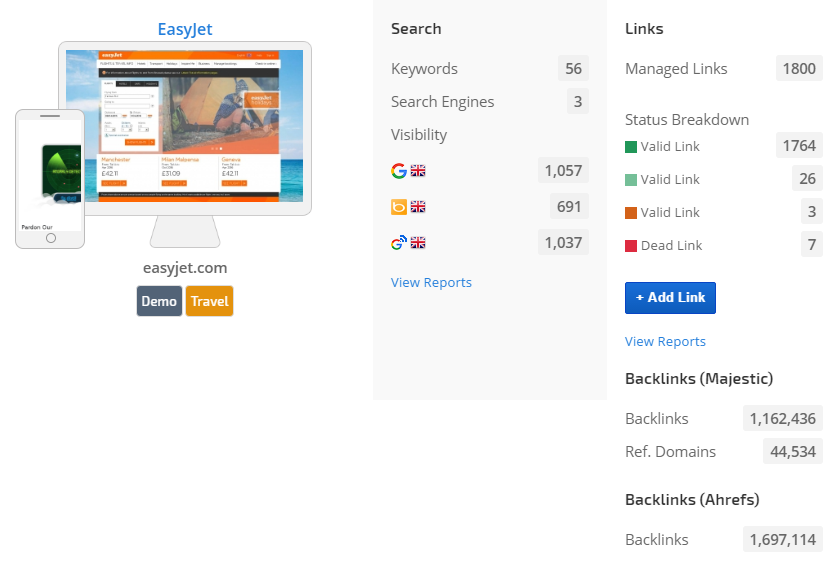
Status Breakdown: the number of links broken down by status type.
Backlinks (Majestic): the number of backlinks and referring domains for the tracked domain as recorded by Majestic.
Majestic Trends Chart: the backlink and referring domains trends reported for the tracked domain by Majestic during the past 6 months.
Backlinks (Ahrefs): the number of backlinks for the tracked domain as recorded by Ahrefs.
Ahrefs Trends Chart: the backlink trends reported for the tracked domain by Ahrefs during the past 6 months.
Last Update: Link data is refreshed weekly on Monday, if you enable the Last Update option then the date will display.
Fig. 15. Link Metric options with an example of how they display. Clicking the +Add Link button launches Link Manager.
Managed Links Status Descriptions
Managed Links will be counted if assigned to an appropriate Campaign. Valid Link status is displayed in different colors based on the way the link source website has coded the link, for example:
Anchor text matched
Anchor text does not match, but the link is correct
The link marked as no-follow
Dead Link status includes:
Host (the site hosting the link source page) not found
The link does not exist on the host
Fig. 16. Managed Links Status Breakdown
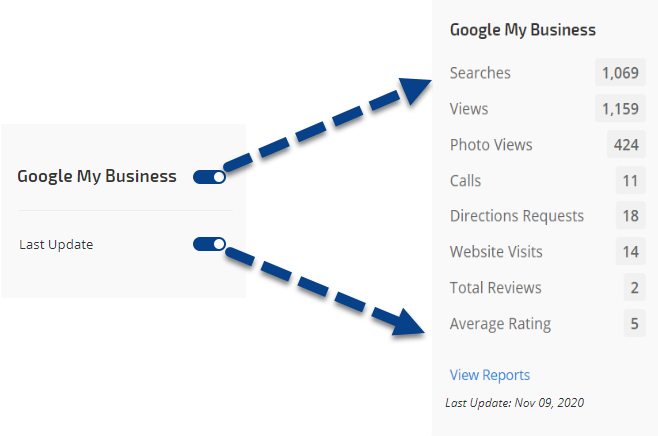
Google My Business Metrics Settings
Managed Google My Business
Switch Google My Business setting to display:
Searches: the number of searches appear for the Business Listing
Views: Views count
Photo Views
Calls: the number Call feature used by a client from Business Listing
Directions Request: the number of requests for directions done from Business Listing
Website Views: the count of website visits from Business Listing
Total Reviews: the total number of reviews are on the Business Listing
Average Rating: average rating collected from the Business Listing
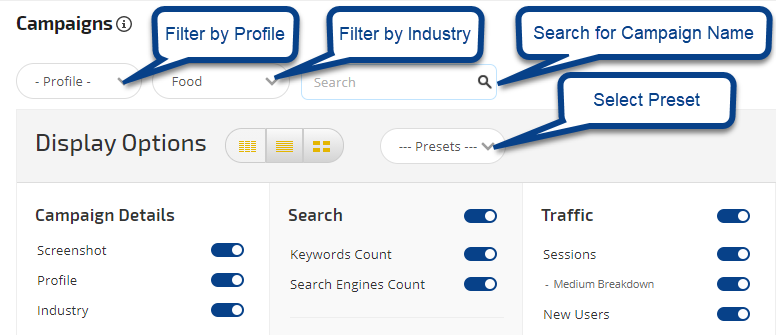
Filters & Presets
Search, Filter by Profile or Industry and Select a quick Preset
Enter a campaign name and click the Search button to quickly bring that campaign into view.
Select a Profile to filter the Account Campaigns Pro View screen for a specific group of campaigns.
Select an Industry to filter the Account Campaigns Pro View screen for campaigns associated with a specific industry.
Select a Preset to quickly change the type of data displayed on this screen.
Fig. 17. Campaigns filters and preset options.
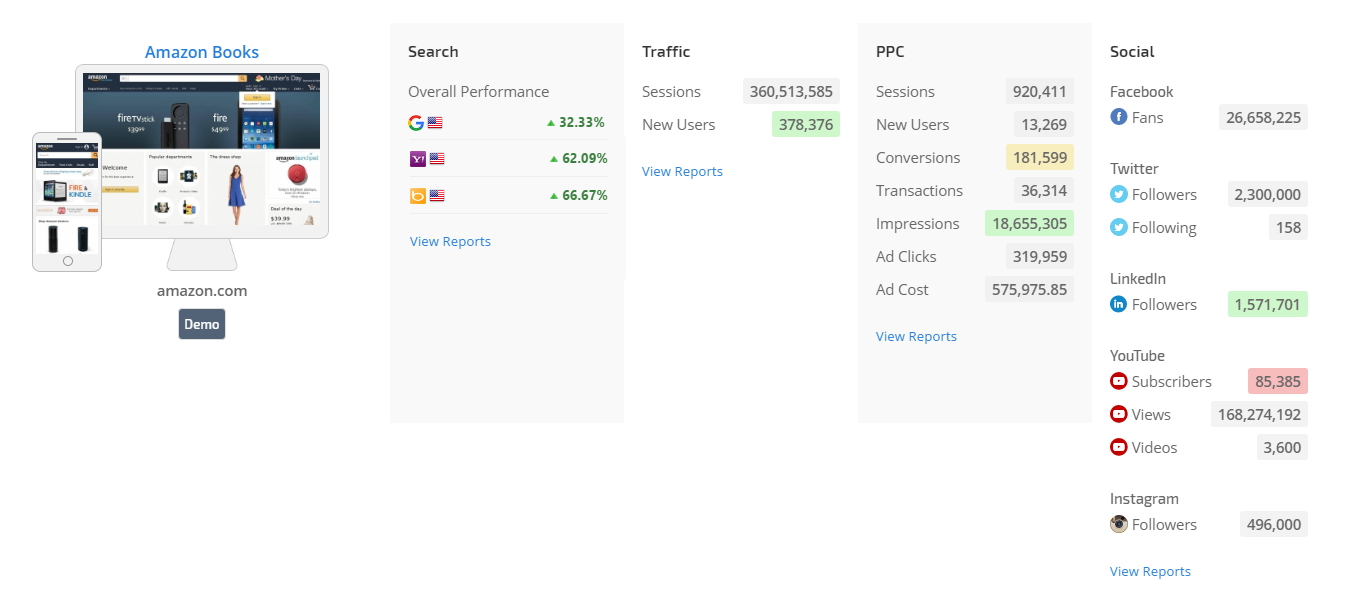
Preset: Marketing Manager
Campaign Details, Search Performance, Analytics Traffic, PPC, and Social Metrics
This preset was configured with the Marketing Manager in mind. It provides a high-level overview of search, traffic, PPC, and social media metrics.
fig. 18. Marketing Manager Account Campaigns preset example
Preset: SEO Basic
Campaign Details, Search Visibility, and Search Console Metrics
This preset was created for the person who needs a quick high-level view of SEO status.
fig. 19. SEO Basic Account Campaigns preset example
Preset: SEO Advanced
Campaign Details, Search Visibility, Rank Performance, and Search Console Metrics
This preset was created for the SEO expert interested in high-level performance metrics.
Fig. 20. SEO Advanced Account Campaigns preset example
For the Link Builder, this preset provides an overview of search visibility and statistics for managed links and backlink data from Majestic and Ahrefs.
fig. 22. Link Builder Account Campaigns preset example
Preset: PPC Expert
Campaign Details, Analytics Traffic and PPC Metrics
For the PPC expert, this preset provides Analytics Traffic sessions and new users alongside PPC performance metrics.
fig. 23. PPC Expert Account Campaigns preset example
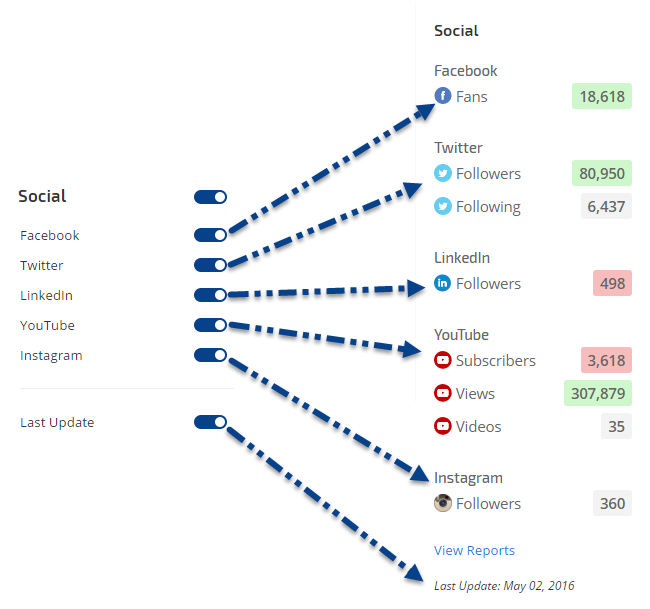
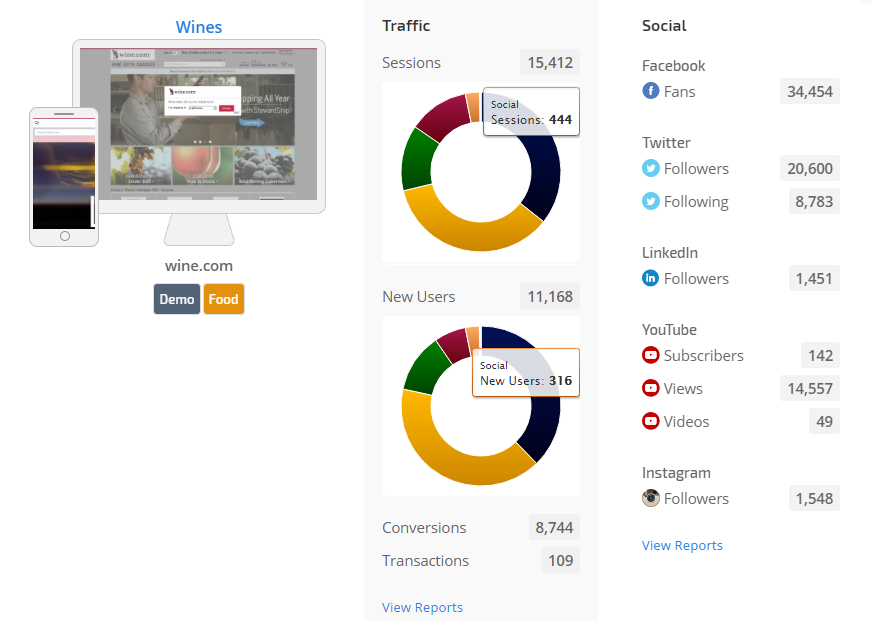
Preset: Social Marketer
Campaign Details, Analytics Traffic and Social Metrics
This preset was built for the Social Marketer interested in traffic sessions, new users, conversions, and transactions that are the result of social media engagement. Statistics for Facebook, Twitter, LinkedIn, YouTube, and Instagram provide a quick snapshot of a company's social popularity.
fig. 24. Social Marketer Account Campaigns preset example
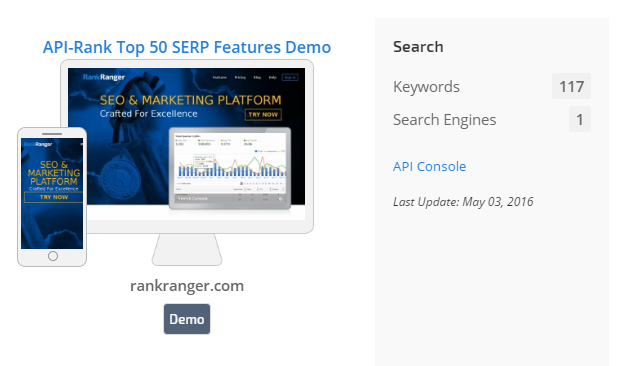
API Campaign Summary Display
API Campaign Details
SEO Intelligence SERP API packages, such as our Rank Top 50 + SERP Features, do not include platform reports so the Account Campaigns Pro View includes the number of search keywords and search engines, along with a convenient link to the API Console for easy construction of API requests. In this view, the words "Keywords" and "Search Engines" link directly to the campaign's Keywords Settings and Search Engines Settings screens.
fig. 25. API Account Campaigns example display
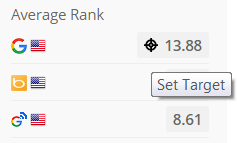
Set Targets for Goal Achievement
Target Results
Hover over a metric result and click the Target icon to set a goal.
fig. 26. Metric Target icon
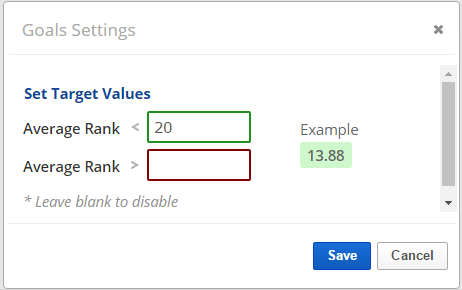
Positive Results
Positive results display a green indicator. In this example, the Average Rank is 13.88 and since the Target Value is set at less than 20, the results are displed with a green background.
fig. 27. Goal settings indicating a positive result
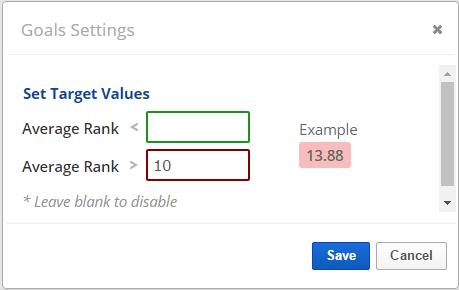
Negative Results
Negative results display a red indicator. In this example, the Average Rank is 13.88 and since the Target Value is set at less than 10, the results are displed with a red background.
fig. 28. Goal settings indicating a negative result.
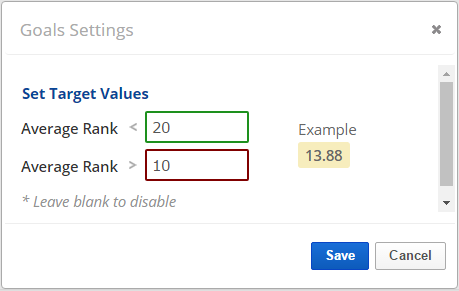
Multiple Goals
When metric results achieve both positive and negative goals, the indicator is yellow. In this example, the Average Rank is 13.88 and since the Target Values are set at less than 20 and greater than 10, the results are displed with a yellow background.
fig. 29. Goal settings indicating that both positive and negative target values were achieved.
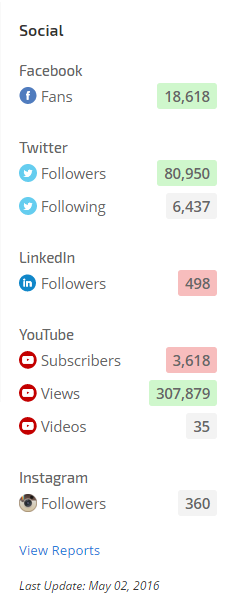
Social Metrics Displaying Goals
fig. 30. Social snapshot displaying Goal achievement
Access Campaign Settings
Quick Access to Campaign Settings
Hover over the website screenshot to reveal the Campaign Settings gear icon
and click it to launch the campaign's settings for further customization.
fig. 31. Campaign Details access to Campaign Settings
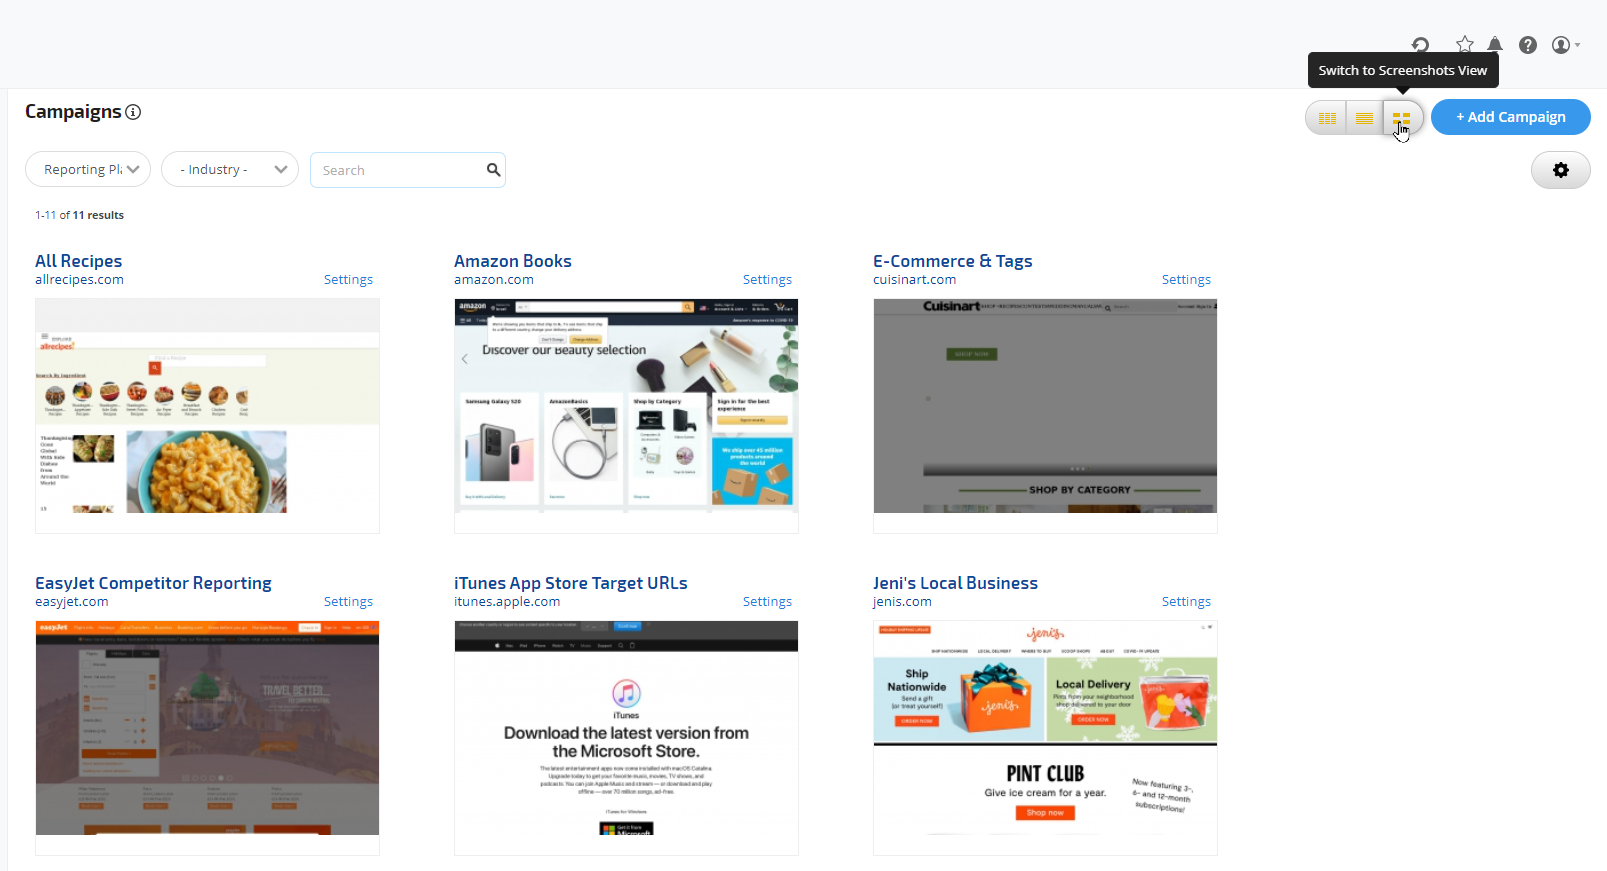
Campaigns Screenshot View
The Screenshot view provides a snapshot of each campaign's website home page. Functionality on this screen includes search,
filters, add campaigns, access to campaign settings, and adjustment of
the number of campaigns to view per page.
Use Screenshots View: click the Display button on the right side of the screen, select the Screenshots icon and click the Update button.
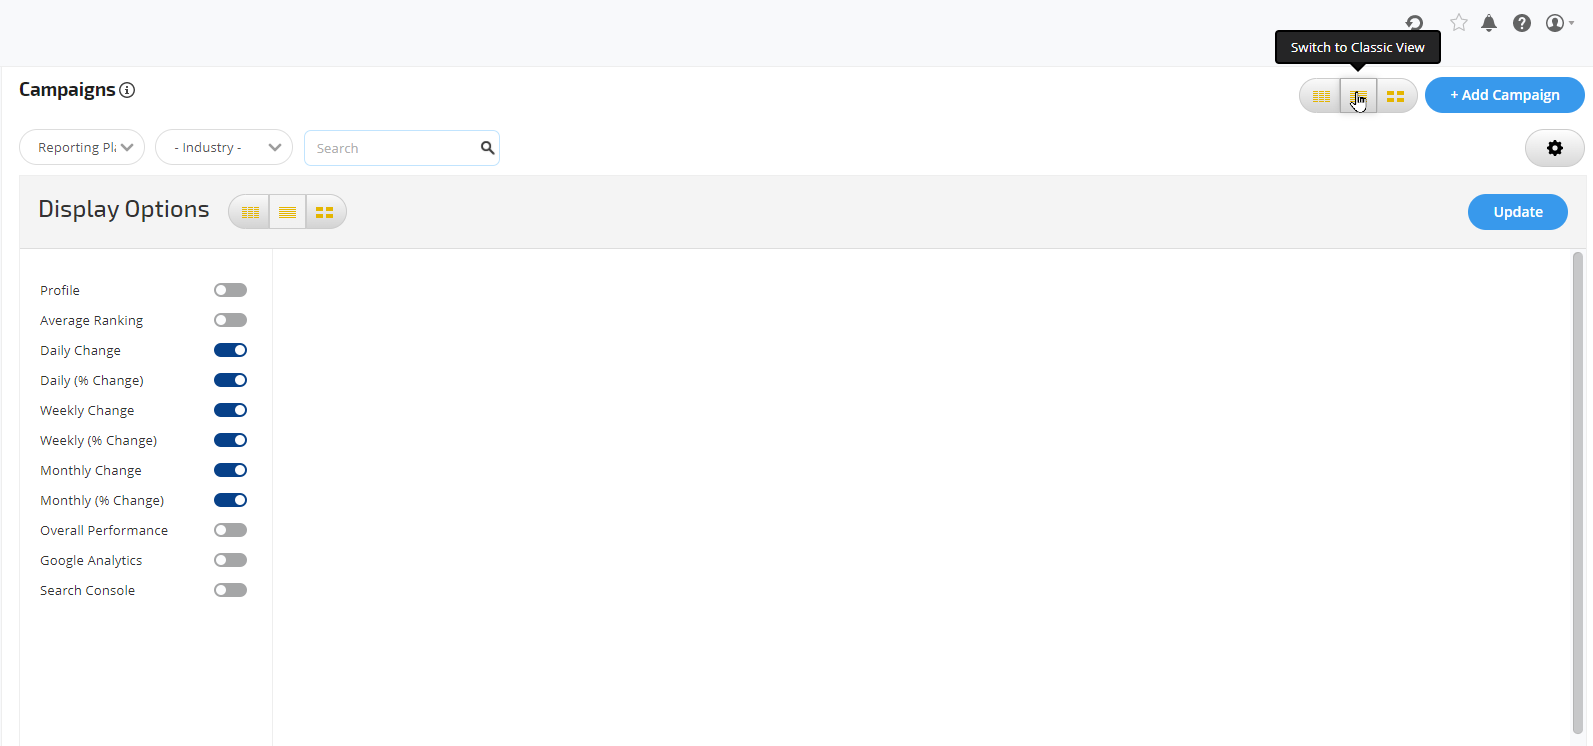
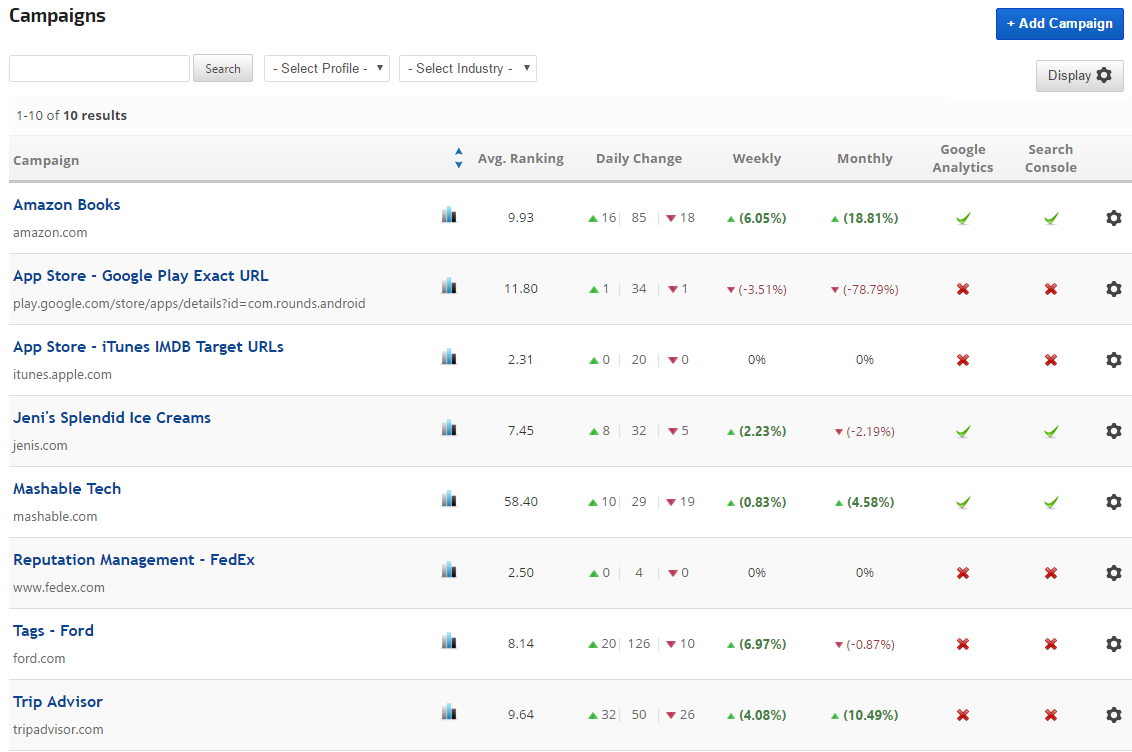
Campaign Classic Table View
Campaign Table View allows you to see an overview of the ranking performance and status of each campaign's integration with Google Analytics and Google Search Console (Webmaster Tools). Functionality on this screen includes search, filters, add campaigns, access to campaign settings, and adjustment of the number of campaigns to view per page.
Classic Display Options
Use Classic View: click the Display button on the right side of the screen, select the Classic list option and click the Update button.
Toggle on or off:
Profile: displays a column with the Profile name associated with the campaign.
Avg. Ranking: displays the average rank for the current day.
Daily Change: Daily change with a number of keywords that increased | unchanged | decreased in rank from a previous day. (refer to the explanation in the next screenshot).
Daily (% Change): Daily percent change (increases or decreases) in rank for all the keywords.
Weekly Change: Weekly change with a number of keywords that increased | unchanged | decreased in rank from a previous week.
Weekly (% Change): Weekly percent change (increases or decreases) in rank for all the keywords.
Monthly Change: Monthly change with a number of keywords that increased | unchanged | decreased in rank from a previous month.
Monthly (% Change): Monthly percent change (increases or decreases) in rank for all the keywords.
Overall Performance: displays the overall keyword performance change within the campaign from the first day that you added the keywords (Day 1) vs. the current day (Today). We check and compare only the keywords that are ranked on both Day 1 & Today - and that rank at least in the top 100 search engine results. If a keyword didn't rank at all we can't consider it because we can't calculate it.
Google Analytics connection status
Google Search Console (Webmaster Tools) connection status
Note: No Data will show for the campaign tracking over 500 keywords.
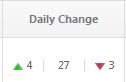
Daily Change Explained
In this example, the:
The green upward arrow represents the number of keywords that
increased in rank since the previous day.
The middle number represents the number of keywords that
remained the same since the previous day multiplied by the number of Search Engines those keywords are being tracked for this campaign.
The red downward arrow represents the number of keywords
that decreased in rank since the previous day.
Overall Performance example
In this example, the up and down arrows followed by percentage numbers indicate the overall increase or decrease in rank for the campaign from the creation date until the current day for keywords that were added to the campaign on the first day.
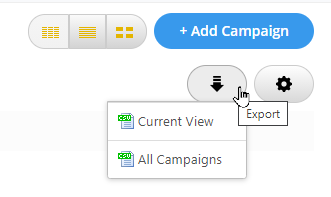
Export Account Campaigns Data
Download to Excel or CSV
To export the account campaign data, click the download arrow button in the upper right of the screen and select Current View (based on the filters and display options you've chosen) or All Campaigns.
 or off
  by clicking the toggle button.