Search our Knowledge Base
Search

Monthly Snapshot


The Monthly Snapshot report colorfully displays your - and your competitors' - search engine rank changes on a monthly basis and includes the top ranking landing page for the last selected month.  A Change column calculates the difference between the rank for the first month and last month selected to display in the report, providing an overall rank change metric. 

Snapshot Day Options Available:

  • Average Rank for each month (Average of the entire month for every month of the selected Date Range displayed with either two decimals or Rounded Average)
  • Rank for selected date of the month (For example, if selected 15, which will display the rank of the 15th of every month for the selected Date Range)
  • # of days is an option for the Average Snapshot Day (This shows the number of days the average is calculated for)
Monthly Snapshot
Located in Reports & Tools > Organic Search > Rank Tracking > Rank Trends
 

Rank Snapshot Single Domain

 
Monthly Snapshot in Single Domain View.

Monthly Rank by the search engine for the selected keywords, keyword tags, and date range.

Monthly Snapshot in Single Domain View


Rank Color Scale

 
Monthly Snapshot in Single Domain View with Rank Color Scale.

A bold Rank Color Scale can be enabled in Report Options > Display Settings.

Monthly Snapshot with Rank Color Scale


Competitive View Rank Snapshot

 
Monthly Snapshot in Competitive View

By selecting the Competitive View option at the top of the report, you can view the Monthly Rank for the selected keywords, keyword tags for the selected date range highlighting the primary domain rank vs. competitors' rank for each keyword and search engine tracked.

Monthly Snapshot Competitive View

Rank Change


Enable Rank Change

In the Display > Rank section of Report Options, if you enable:
  • Baseline, then the baseline column displays in the report.
  • MoM Change, then the rank change (increase/decrease) for a keyword for the last two months of the selected date range will be displayed in the table.
  • Overall Change, then the difference between the baseline rank and the latest month displayed in the report is calculated and displayed in this column. 
The regular Period Change column is the difference between the first and last month's rank displayed in the report.


Brand Impact Competitive View

 
Reputation Management Monthly Rank Snapshot

By selecting the Brand Impact option in the Display > General settings section of Report Options, and Competitive View, you create a report that highlights the URLs that have positive and negative impacts on the brand per keyword.

brand impact monthly rank snapshot


Brand Impact URLs can be set up in the Campaign Settings > Websites screen. Please refer to Reputation Management Campaign Setup for more information.

brand impact settings


Visibility Widget

 
Visibility Widget Single Domain View

Switch On the Visibility Widget to show the Visibility Share % and the graph with daily Visibility Score for a primary domain.

Monthly Snapshot Visibility Widget Single Domain View


Switch from Single Domain View to the Competitive View to display Visibility Share % option is enabled, producing a summary above the graph that details the percentage share of the campaign website compared to tracked competitor domains and graph with the daily Visibility score.

Monthly Snapshot Visibility Widget Competitive View


Report Options

 
Select Date Range

Date:

  • Report Dates: select the start and end dates.
  • Snapshot Day: select the Average rank or 1 specific day of the month that you want the report based on. 
  • # of days: If you select Average for the Snapshot Day, then you may opt to display the number of days that were included in the average rank calculation. For example, a result of 25 (29) means that the keyword held an average rank position of 25 and that it ranked for 29 days during the particular month.
  • Rounded Average: by default, the average rank is rounded down to a whole number in such a way that 1.x will always equal 1. If you want the decimal place included, then disable this option.
Important:  Period Change and Overall Change columns calculate based on the dates and snapshot day selected in this section.
Select Monthly Rank Report General Settings

Display:

  • Custom Report Title: (optional) enter a Title to display centered at the top of your report. This title will also display on your White Label PDF Reports; both in the bookmarked links and at the top of the report.

Display General Columns:

  • Search Engine: displays a search engine icon per row in addition to the search engine name at the top of the table)
  • Website (URL) per row. 
  • Brand Impact: select Positive, Neutral, and/or Negative and report Competitive View to display a reputation management report.
  • Keyword Tags: displays a column containing tags per keyword. To display only specific tags, use the Keyword Tag filter.
  • Landing Page: displays a column containing the URL of the page that the keyword ranked highest for on the last day of the report period.
  • Landing Page Tag: if you have added campaign Landing Page Tags, you can display them in the report by enabling this setting.
  • SERP Snapshot: enable to display the SERP Snapshot column with a screen icon that can be clicked to view the actual search engine results per keyword
  • Keyword Performance Graph: enable to display a graph icon that when clicked launches a trend graph displaying rank and visibility or landing pages, and provides a quick option to launch the SEO Monitor per keyword
  • Rank Color Scale: displays rank cells with a heat map based on positions.
Show or hide report columns

Display Rank Columns:

  • Baseline: displays a column with the rank on the 1st day the keyword was added to the campaign, or if the keyword did not rank within the maximum supported results tracked by each search engine, then Baseline displays the first rank recorded by Rank Ranger for the Keyword when it did rank.
    Refer to our current list of supported search engines for rank depth and additional information.
  • Mom Change: displays a column with a keyword rank change for the last two months of the selected date range.
  • Period Change: displays a column that represents the rank change between the first month of the date range and the last month
  • Overall Change:  displays a column with the difference between the baseline rank and the latest month displayed in the report. 

Display Keyword Metrics Columns:

  • Avg. Monthly Volume: based on Keyword Planner when the keyword was added to the campaign (learn more.)
  • Keyword Difficulty: Keyword Difficulty Score from 0-100. Learn more...
Notes in the Monthly Snapshot Visibility Graph

Notes: adding the notes into the graph of the Visibility Widget

  • Show/Hide Notes (Single Date)
  • Show/Hide Notes (Single Date): these are notes with a date range.
  • Or click the +Add Note link to create a new note
Show or hide report columns

Sort and Group:

  • Sort Field: select the field you want the report to be sorted by.
  • Sort Direction: select the sort direction ascending or descending.
  • Group by Domains or Keywords determines the content of each table.
reorder columns

Columns Order:


There are two ways to re-order the columns:
  • Drag and drop - to move the column to the desired location in one step
    or
  • Click the arrow down/up - to move one column space at a time

    Note: The hidden columns can not be re-ordered. If the table doesn't display the desired column, go to the Report Options > Display and turn the toggle ON for that column, and then re-order the columns. 

Average rank rules in Weekly Average Rank Report

Filters:

  • Display: Select from the list of Top 10,20,30 ... Top 100 rank to display the results of the last week of the selected Date Range
    OR Filter by
  • Minimum Rank: specified minimum and
  • Maximum Rank: specified maximum rank range you want to display
  • Search Volume: Filter by Search Volume that is greater, equal, or less than the specified value. 
select Keywords

Keywords:

  • Select Keywords you want to be displayed in the report.

Important: When you add keywords to a campaign you need to open Report Options and check the boxes beside the new keywords or click the Reset button to display all keywords in your report. The number of keywords currently included in your report displays directly below the report title where you'll find the words "Displaying # out of ## keywords" for your convenience.  That calculation comes from the settings you select here.

Show, hide and select Keyword Tags

Keyword Tags:

  • Select Tag(s) to filter the report results by using the All or None link for quick selection, or individually check the boxes beside the keyword tags to be included in the report.
  • Select a Tag Filter
    Contains at least one (OR) - this option will include any of the selected keyword tags.
    Require all selected (AND) - this option requires all of the selected keyword tags in order for the keyword data to display in the report. 

Important: Refer to Tag Manager for more information about creating Keyword Tag Groups and Tag Options.

Select Website Domains

Websites:

  • Choose whether or not to highlight the primary URL (campaign domain) in the report.
  • Select the website(s) to be displayed in the report: use the All or None link for quick selection, or check the boxes beside the individual sites.


Select Search Engines

Search Engines:

  • Select the search engine(s) you want to be included in the report.
  • Use the up and down arrows to reorder the display of search engines in your report, if desired.

Select Search Engines

Widgets:

  • Show/Hide Visibility Widget.

Save Report Default

Save

  • Click the Apply Changes button.
Save As Default Settings (if desired).
  • Account Default
  • Profile Default
  • Campaign Default
  • Client Dashboard Default
Refer to Report Default Settings for more information about default setting features and uses.

Please refer to Navigating Rank Ranger for additional information regarding report views, data export, adding this report to an existing White Label PDF report, and more.


Add to PDF Report


Conveniently add a report or graph with its current settings to a PDF report by hovering over the gold gear icon and selecting Add to PDF Reports

add report to PDF


Select the PDF Report that you want the report or graph added to
             
select white label report

Drag the new report or graph into the position you want it to display in the PDF and confirm that the Date settings do not conflict with the automated scheduling settings.

PDF Report Settings - Monthly Snapshot

Reports and graphs can be added to automated PDF reports via the report screen (as described above) or manually in the PDF Report Content screen. If the report is added via the:
  • report screen, then begin by clicking the Edit button corresponding to the report
  • PDF Report Content screen, then click the Add Report button and select the Campaign name and Report: Monthly Snapshot

Date


Expand the Date Options section and in the Show Report data of the last field type in the number of periods to be displayed in the report.

In the next field select one of the following options:
  • days
  • weeks
  • months
  • years
In the ending on the field select one of the following options:
  • first day
  • last day
  • or a specific day of the month
  • or a specific day of the week (when weekly reports are selected)
In the of field select one of the following options:
  • this
  • last
In the next field select one of the following options:
  • week
  • month
In the Snapshot Day field select one of the following options:
  • Average
  • A date of the month
Display the # of Days by moving the slider to the right.

The selection must produce a logical date setting based on the PDF report's automated scheduling (at the bottom of the Report Details screen). For example:
  • last day of last month
  • 1st of this month
  • last day of last week
If the report is scheduled to be sent every Monday, then the following example would be invalid:
  • Saturday of this week (because weeks begin on Sunday and if reports are sent on Monday, then Saturday of this week hasn't yet occurred).
If the report is scheduled to be sent on the 1st day of every month, the following example would be invalid:
  • last day of this month (because it's only the 1st day of the month the report is being sent)

Display


Custom Report Title (optional): displays across the top of the report section

General 
  • Display Brand Impact by moving the slider to the right and putting a check in the box(es) next to the impact you want to include. Brand Impact is set in the Campaign Settings > Websites screen.
  • Display a Keyword Tags by moving the slider to the right. Displays a column containing tags per keyword. To display only specific tags, use the Keyword Tag filter.
  • Display the Landing Page column by moving the slider to the right. Displays the URL of the page that ranked highest for the keyword on the last day of the report period.
  • Display Rank Color Scale by moving the slider to the right. Displays rank cells with a heat map based on positions.

Rank 
  • Display Baseline by moving the slider to the right. Displays a column with the rank on the 1st day the keyword was added to the campaign, or if the keyword did not rank within the maximum supported results tracked by each search engine, then Baseline displays the first rank recorded by Rank Ranger for the Keyword when it did rank.
  • Display a Overall Change by moving the slider to the right. Displays a column with the difference between the baseline rank and the latest month displayed in the report.

Keyword 
  • Display Average Monthly Volume by moving the slider to the right. Based on Keyword Planner when the keyword was added to the campaign. (learn more about Keyword Search Volume.

Sort Options
Sort Field: select the field you want the report to be sorted by.
Sort Direction: select the sort direction ascending or descending.

Group By option: allows you to group by Domain (for viewing 1 table per keyword including competitor domains) and Keywords (for viewing 1 table with all keywords for 1 domain).

Keywords


Select Keywords you want displayed in the report.

Tags


  • Select Keyword Tag(s) to filter the report results by: use the All or None link for quick selection, or individually check the boxes beside the keyword tags to be included in the report.
  • Select a Tag Filter Contains at least one (OR) - this option will include any of the selected keyword tags Require all selected (AND) - this option requires all of the selected keyword tags in order for the keyword data to display in the report

Websites


Highlight the Primary URL (campaign domain) by moving the slider to the right.

Select the Website(s) that you want displayed in the report.

Search Engines


Select the Search Engine(s) to display in the report. 

If multiple Search Engines are selected, you have the option to change the display order by clicking the arrow next to the Search Engine and dragging it into the desired order.


Add to Marketing Dashboard


Conveniently add a report or graph with its current settings to a marketing dashboard:

1. Hover over the gold gear icon and select Add to Marketing Dashboard
2. Select the Dashboard (campaign name)
3. Select the Dashboard Page that you want the report added to


add report to PDF


4. Click the "Go to Dashboard" link to further customize the report (e.g., drag it to a specific position on the page, change date settings, etc.)


Refer to the Report Options section for details regarding the display settings, filters and sort options available for this report.

The report date (or date range) is governed by the selected Dashboard date option: Date Selection or Fixed Periods, learn more...

  • Daily reports default to the last day of the selected period
  • Weekly and monthly reports default to 1 month of data
To change the number of weeks or months displayed in a specific report, click the gear icon for any marketing dashboard report element and expand the Date option section, enter the number and click the Save Button.
 
marketing dashboard report date options


Add to Client Dashboard


Customize Report for Client Dashboard

Client Dashboards display our default report options for each individual report and graph until you modify them. To customize the display of the report, expand the Report Options section, change the settings and click the Apply Changes button.

Then expand Report Options again and hover over the Save icon and select Save as Default for Client Dashboard.

report options

After saving the Client Dashboard default, any changes that you make to the report options will not affect the display in the Client Dashboard unless you overwrite it by following these instructions again.


Enable the Report or Graph to display in the Client Dashboard

Open the Campaign Settings > Client Dashboard screen and check the box corresponding to the report(s) you want displayed in the dashboard, and then click the Save button. 

access permissions to client dashboard


Refer to Client Dashboard Settings documentation for additional instructions for customizing your dashboard.


Rank Values Explained


The meaning of 100+, N/A, N/R, "-" and   


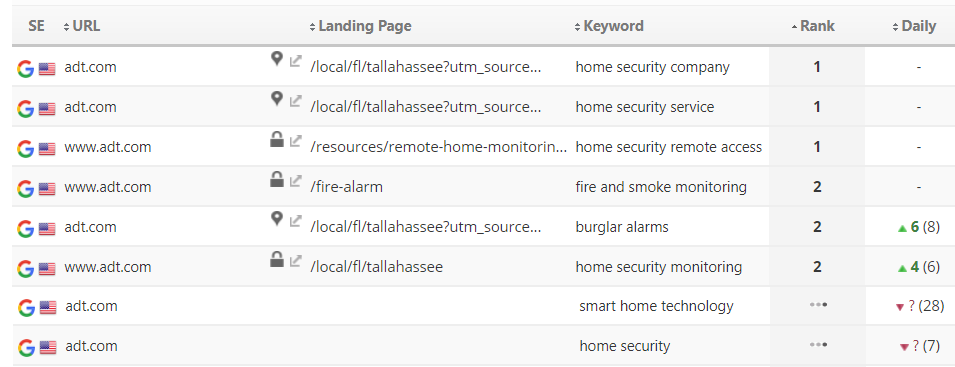
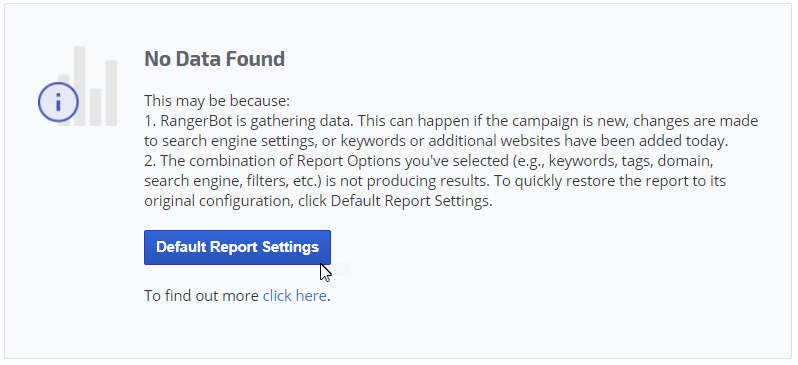
The three moving dots   are an indicator that rank tracking is in progress for the keywords and you should check the report later in the day for results.  We do the best we can to complete the rank tracking as early as possible every day, however, there are some factors that are beyond our control (e.g., search engine response rate).

3 dots in a Rank Dashboard report
Rank Tracker Dashboard displaying tracking in progress for the keywords "smart home technology" and "home security".


100+ is our system default for when our rank tracker did not find the keyword ranking for the primary domain within the maximum supported results tracked by each search engine (refer to our current list of supported search engines and rank depth for additional information), and the search engine did return webpages on other domains with results for the keyword.
 
rank of 500+
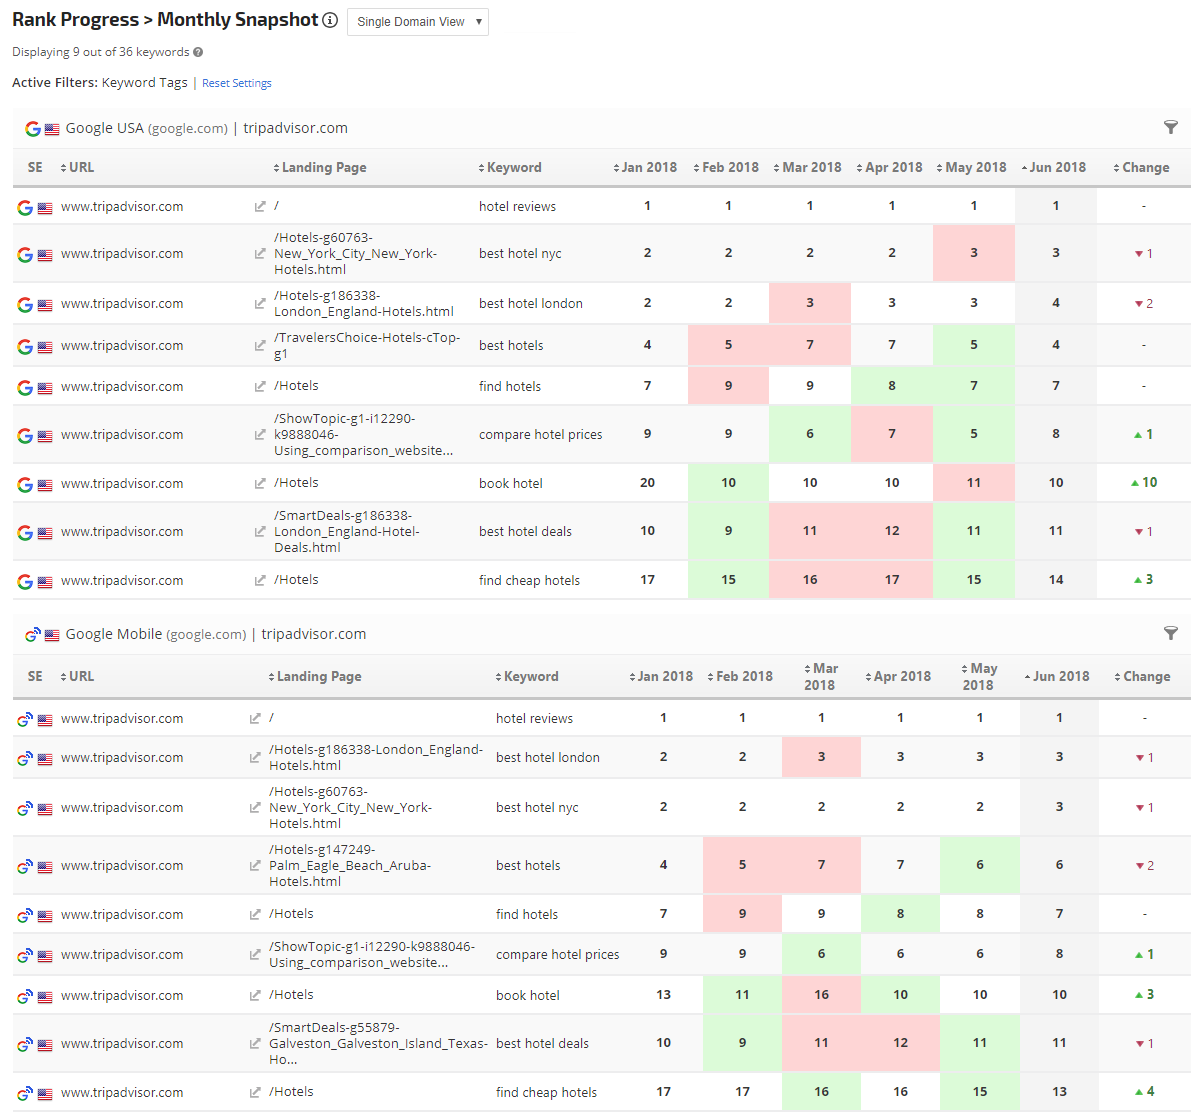
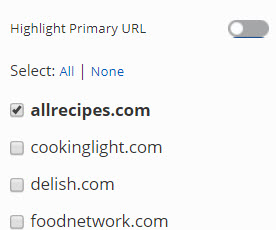
Rank Tracker Dashboard displaying 100+ as the rank result for several keywords. Options exist in the Account Settings > Theme & Localization screen to set no rank within tracked results as "100+", "N/A", "NR", or "-"
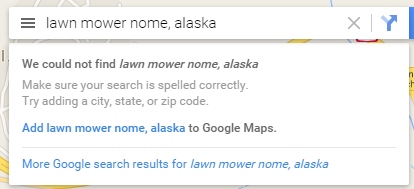

example of N/AN/A means that the search engine did not return any result for the keyword, which most likely means that the keyword is not indexed by the search engine at all (e.g., the keyword "lawn mower Nome, Alaska").

N/A is also an account-wide option that can be selected in the Theme & Localization settings to represent no rank value (e.g., instead of 100+), other options include "NR", "-", or "100+". Please check your account settings before requesting assistance for a keyword that you are certain is indexed.

If you're using one of our rank reporting APIs, they return a dash "-" in the rank field when no value is available.

No Data Found


If your account is relatively new, and depending on several variables (number of keywords, number of search engines, date range, etc.), rank reports can take anywhere from a few minutes to a 8 hours until your first reports will display all of the data.  In the case of a campaign that is a day or more old, incorrect campaign configuration can lead to empty reports as well.  Clicking the Default Report Settings button usually resolves the issue.

no data found


Common causes for 'no data found' message:
  • Account is new and our rank tracker is gathering data
  • Invalid date range (e.g., the report start date is older than the campaign creation date)
  • Keyword / URL combination on report options was not found 
  • within the maximum supported results tracked by each search engine (refer to our current list of supported search engines and rank depth for additional information). Note that this is relevant only for rank reports and graphs.
  • Incomplete campaign setup (missing URL / Keywords / Search Engines / Authorized Connections)
  • Website is new and hasn't been indexed by search engines yet
  • Authorized connection to a third party data provider has expired or been configured incorrectly (refer to the third party integration or webmaster tool documentation) 
  • Delays or outage of third party data provider (e.g., Google, Facebook, Twitter, etc.)

If keywords are missing completely from a rank report, there are 2 possibilities:
  • New keywords may have been added to the campaign, but not selected. Learn more...
  • The search engine did not return any result for the keyword on any domain. In some rank reports, Rank Ranger will not display keywords for which the search engine displays no results - meaning no results for any URL on the web.  So if Google.com has results, but Google Mobile does not, you will see results for the keyword in the Google.com table, but the keyword will not display at all in the Google Mobile table. That is the way the system is designed because it needs a response from the search engine in order to record a number and when there is no response, then there is no number.

If you need assistance after reviewing and trying the options listed above, please  contact our technical support team.

Campaign Keyword Limit

There is a maximum limit of 1000 keywords per campaign in order to ensure efficient report generation and convenient viewing. Adding more than 1000 keywords to a campaign will cause some functionality to be disabled.

If you need to track more than 1000 keywords for a site, then best practice is to create additional campaigns (e.g., separate them by keyword category, location, tags, etc.).  If you have an Enterprise package, you can view rank performance data for multiple campaigns in the Portfolio Report and by using cross-campaign metrics in the Insight Graph and Single Metric Widgets.

Get the ultimate SEO tools with the Rank Ranger Software
Learn More About Rank Ranger