- Social Account Header
- Top Graph (with or without labels)
- Age & Gender Charts
- Top Countries & Followers Online
- Posts Summary
- Stroy Summary
- SEO
- Rank Tracker
- Local SEO
- Mobile SEO
- Link Manager
- Landing Pages
- Social Signals
- On-Page Optimization
- Enterprise SEO Solutions
- Marketing
- Competition Analysis
- Insight Graph
- Keyword Research
- Graphs & Widgets
- Market Reach
- Marketing KPI
- Brand Visibility
- White Label SEO
- Marketing Dashboard
- Client Dashboard
- PDF Reports
- PDF Templates
- Other
- Email Notifications
- Portfolio Management
- Integrations
- Google Analytics
- Search Console
- Pay Per Click
- WeDevelop
- API
Instagram Analytics Report
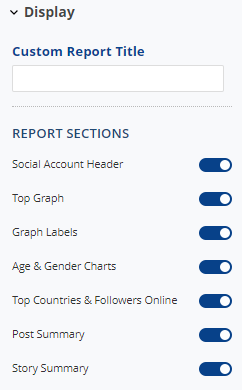
The Instagram Analytics report provides the data needed to analyze social KPIs, monitor trends, and measure engagement, plus includes the flexibility to add specific report sections to white label dashboards and PDF reports for sharing with clients and coworkers. Sections include:
Located in Reports & Tools > Digital Marketing > Social Media
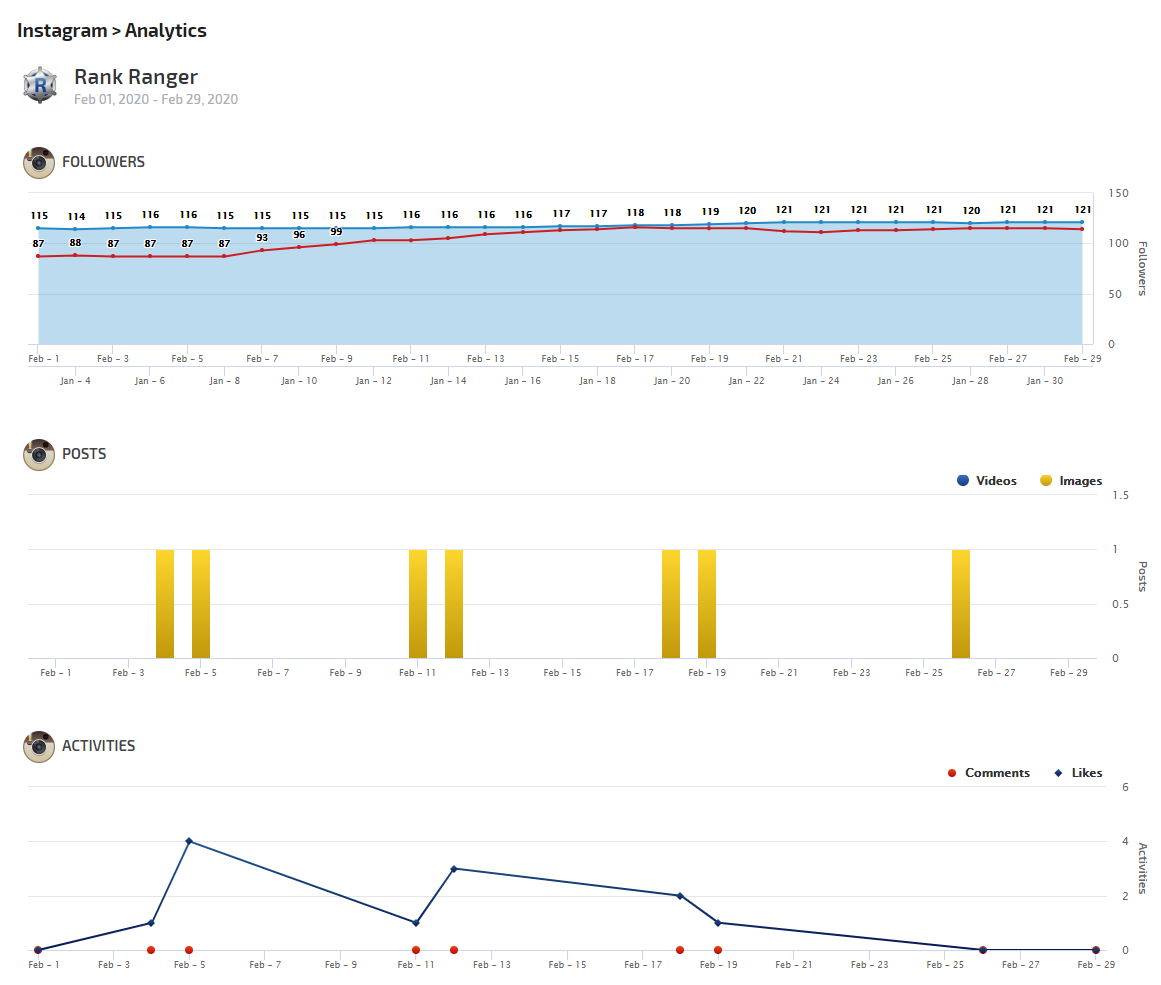
Top Graph for Trends Analysis
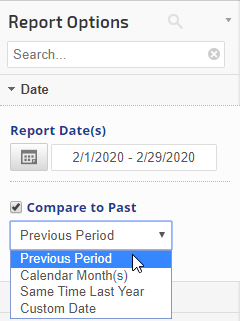
In the Report Options Date settings, you may select to compare to past (the red line in this example) and in Social Analytics settings you can select from a variety of key metrics to trend in this graph.
In the Report Options Date settings, you may select to compare to past (the red line in this example) and in Social Analytics settings you can select from a variety of key metrics to trend in this graph.
Audience chart by Age and chart by Gender
In this section, two charts are displayed one broken down by Age and another one broken down by Gender
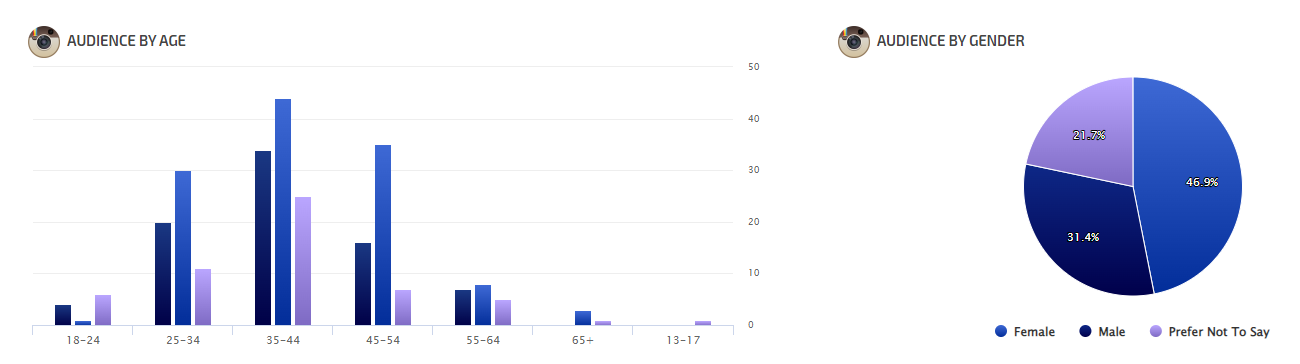
In this section, two charts are displayed one broken down by Age and another one broken down by Gender
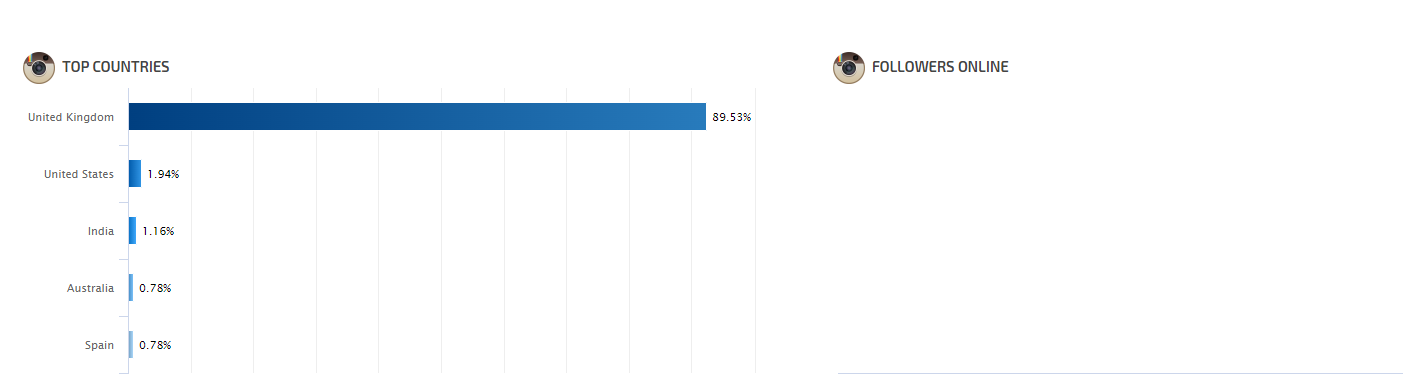
In this section, the two charts are displayed one with break down by Top 5 countries and another one by Followers Online. If there is no data then the chart will display no data.
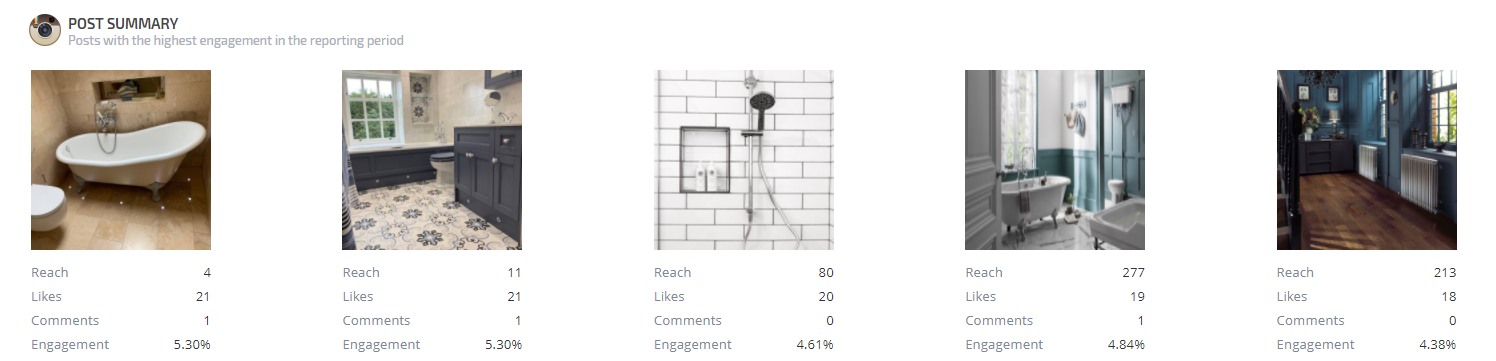
In this section, the images of the 5 top posts will display with a number of Reach, Likes, Comments, and Engagement for each post.
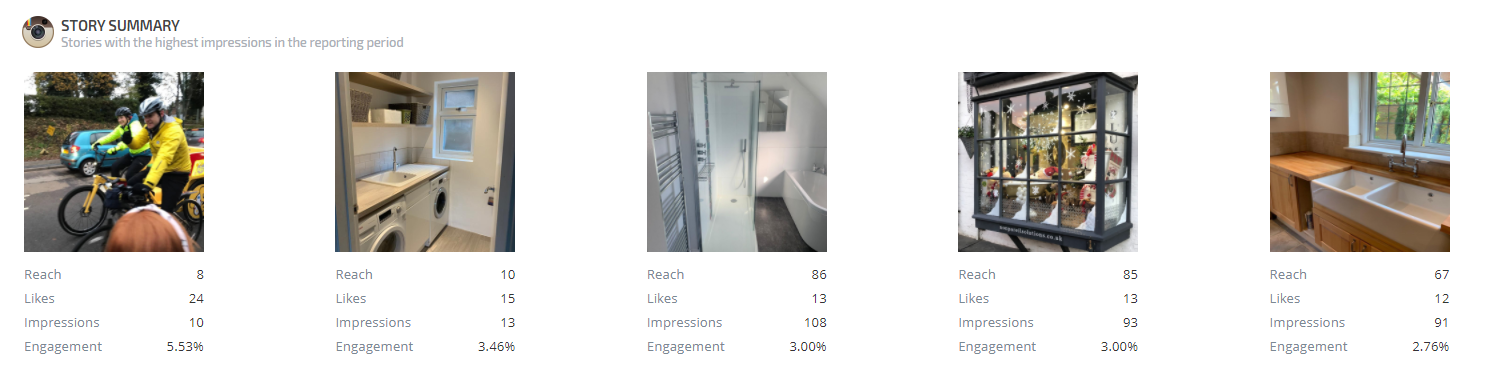
In the Story Summary section, the images of the 5 top stories will display with a number of Reach, Likes, Impressions, and Engagement for each story.
 |
Date
|
 |
Display
|
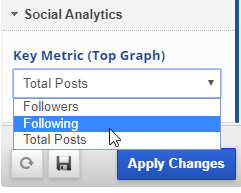 |
Key MetricSelect one metric to display in the top graph
|