Search our Knowledge Base
Search

Google My Business Highlights


The Google My Business Highlights report presents 1 to 3 positive highlights of GMB metrics that can help a business determine how the customers find their business listings on Google. The number of highlights depends on the number of positive (increased data) compared to the previous year/month(s) data. The order of highlights displayed is descending based on the percentage increase.

The following are the rules for displaying the highlights data:
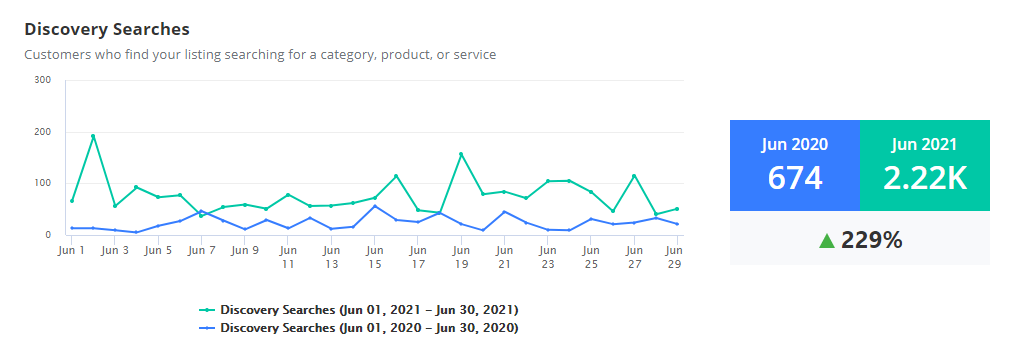
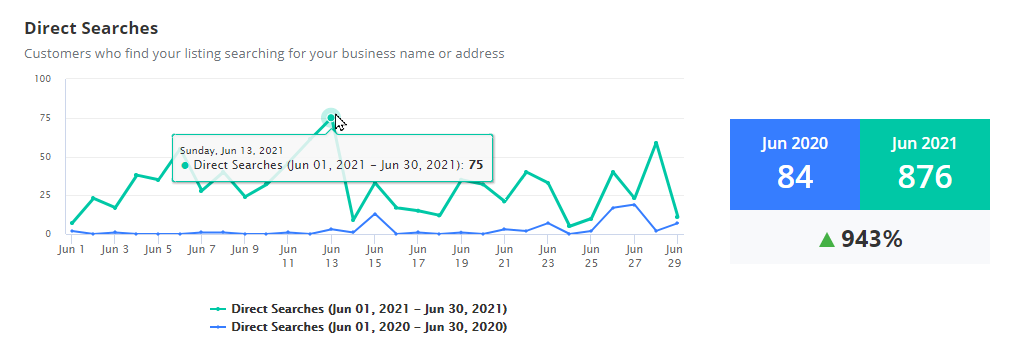
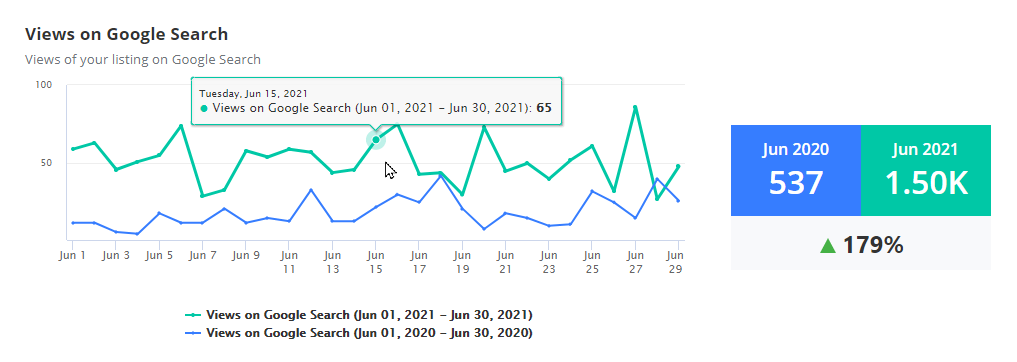
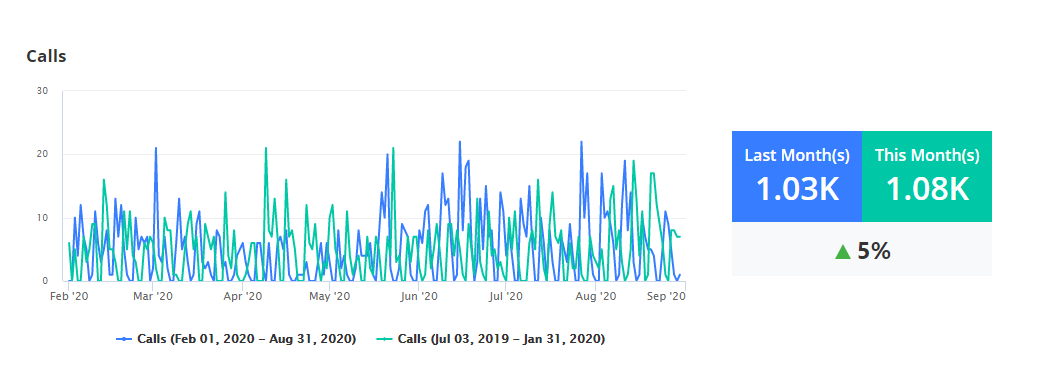
  • The year-over-year compared data is displayed if both the current month of this year and the current month of last year's data exist (Example: June 2020 and June 2021).
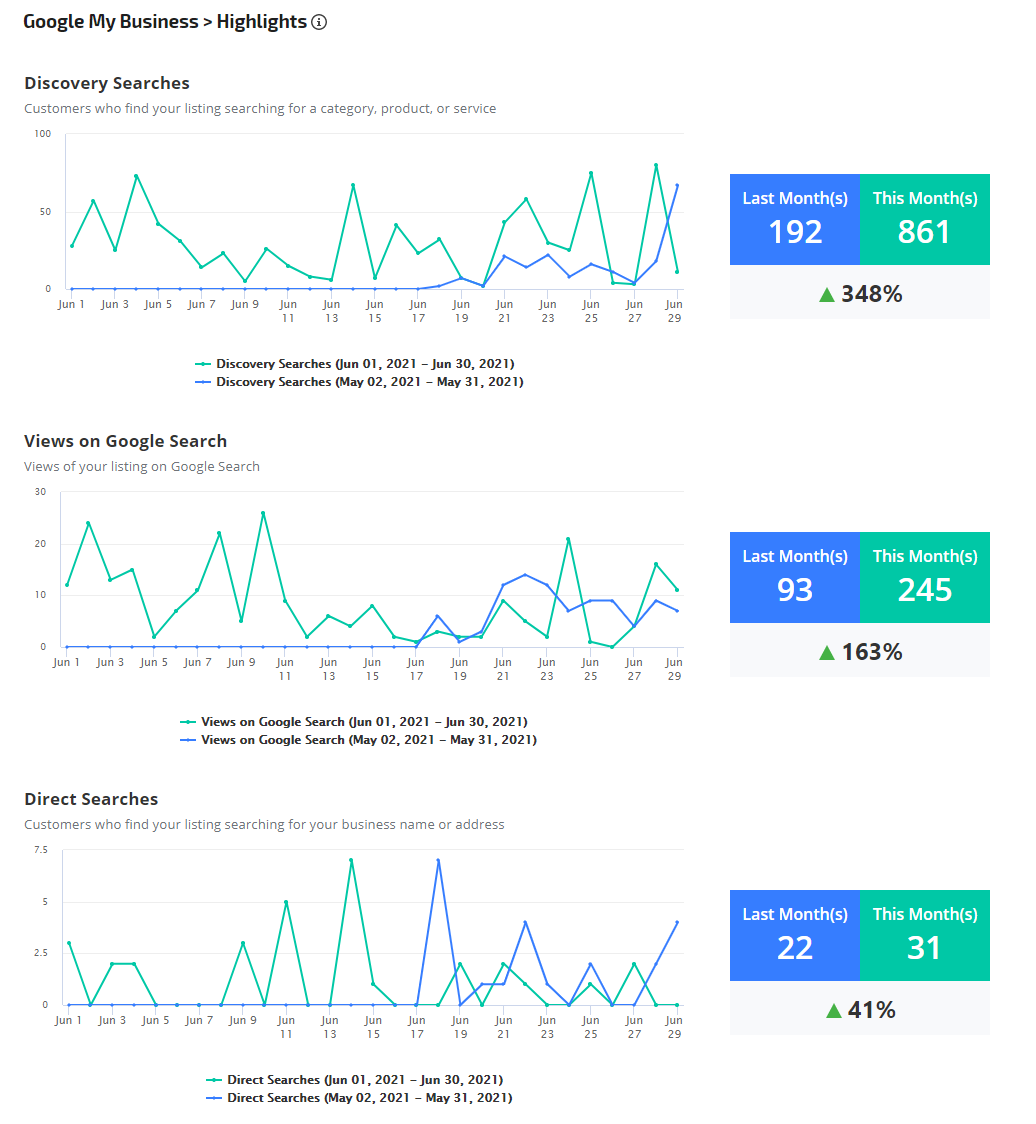
  • A month-over-month comparison is displayed when the data is missing for one of the months of the year-over-year comparison (Example: This Month(s) and Last Month(s)).
  • 100% increase is displayed when the data is missing for both the previous month of the year-over-year and for the month-over-month comparison while the data for the current month exist.
  • No highlights will be displayed if there was no positive data reported.

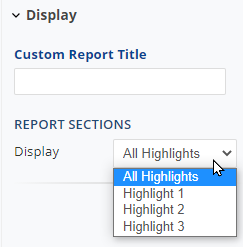
The highlights report can include 1-3 customer actions from the following list:
  • Discovery Searches
  • Direct Searches
  • Views on Google Search
  • Views on Google Maps
  • Photo Views
  • Calls
  • Directions Request
  • Website Visits

Integrate your Google My Business account with Rank Ranger to view and share this report in white label dashboards and PDF reports.


Google My Business Highlights report
Located in Reports > Organic Search > Google My Business
 

Discovery Searches


Customers find your listing by searching for a category, product, or service. The graph displays the daily amount of Discovery Search for the picked date range and compared data for the same date range of the previous year/month(s). On the left of the graph, the total Discovery Searches for the given data range compared to the date range of the previous year/month(s) with the change in percent increase.  
Google My Business Discovery Search


Direct Searches


Customers find your listing by searching for your business name and address. The graph displays the daily amount of Direct Search for the picked date range and compared data for the same date range of the previous year/month(s). On the left of the graph, the total Direct Searches for the given data range compared to the date range of the previous year/month(s) with the change in percent increase.  
Google My Business Direct Search

Views on Google Searches


Customers who are viewing your listing on Google Search. The graph displays the daily amount of Views on Google Search for the picked date range and compared data for the same date range of the previous year/month(s). On the left of the graph, the total Views on Google Searches for the given data range compared to the date range of the previous year/month(s) with the change in percent increase.  
Google My Business Views on Google Search

Calls via Listings


Customers who are calling using your Google My Business listing. The graph displays the daily amount of Calls for the picked date range and compared data for the same date range of the previous year/month(s). On the left of the graph, the total Calls for the given data range compared to the date range of the previous year/month(s) with the change in percent increase. 
Google My Business Calls via listing

Report Options


report date range

Date

 
  • Click the calendar icon to select a report date range
display settings
display settings

Display Settings

 
  • Custom Report Title: (optional) enter a title to display at the top of this report.
  •  Report Sections: the Select dropdown with a choice to display either all highlights or one of the selected highlights.
  • Highlights Colors: select desired colors for the Previous and Current Periods from the available colors on the color palette or choose a custom color. The selected colors will be applied to the background of the totals for the previous and current periods and to the corresponding graph lines. 
Click the Apply Changes button after each change.


Get the ultimate SEO tools with the Rank Ranger Software
Learn More About Rank Ranger