The Facebook Insights Audience report presents a demographic breakdown of fans who have liked the Facebook page being tracked. Specifically, the report enables you to access Page Fan demographic breakdowns according to age, gender, geolocation, and language.
Facebook indicates that their Insights metrics are only generated for Facebook Pages that have more than 100 people that like it. Likewise, demographic metrics, such as age, gender and location, are available in Page Insights once there is data for 100 or more people.
Important! In order to view this report, you must authorize a connection to a Facebook account that has Admin permissions for a Facebook Page.
Facebook limits the amount of data available via their API to 90 days. We follow Facebook's best practices in order to provide the reporting that they allow. We review third-party developer API changes monthly, so if they change the rules to allow for a longer reporting period, we'll update our reports accordingly.
- SEO
- Rank Tracker
- Local SEO
- Mobile SEO
- Link Manager
- Landing Pages
- Social Signals
- On-Page Optimization
- Enterprise SEO Solutions
- Marketing
- Competition Analysis
- Insight Graph
- Keyword Research
- Graphs & Widgets
- Market Reach
- Marketing KPI
- Brand Visibility
- White Label SEO
- Marketing Dashboard
- Client Dashboard
- PDF Reports
- PDF Templates
- Other
- Email Notifications
- Portfolio Management
- Integrations
- Google Analytics
- Search Console
- Pay Per Click
- WeDevelop
- API
Facebook Insights Audience

The Age Chart within the Facebook Insights Audience report indicates the number of users who have liked your page within a reporting period according to age ranges. Each range includes separate columns that segment the age range by gender.

The Gender Chart offers insights into the total percentage of both male and female page fans. To see the actual number of male and female page fans within a reporting period you can engage the chart's hover ability.

Showing the distribution of your Facebook page fan according to country, the data in this section of the report is displayed visually via a column based graph. The top 10 countries are included in the graph, with the rest grouped in the 'Other' column.
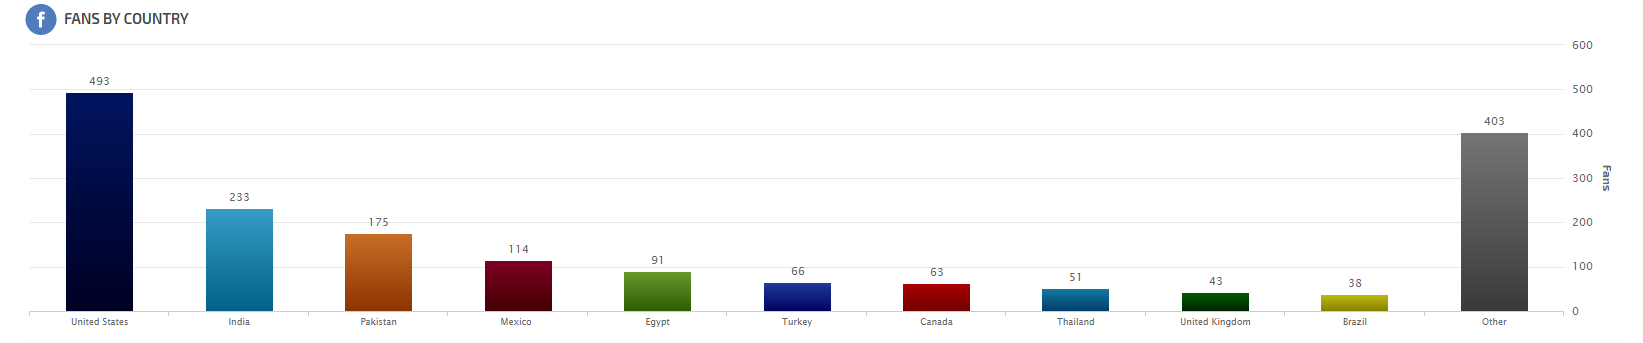
Data for all fan countries is displayed in table format.

The Fans by City graph offers a localized view of your page fan demographic by indicating fans according to specific city. The top 10 cities are included in this graph, with the rest grouped together in the "Other" column.
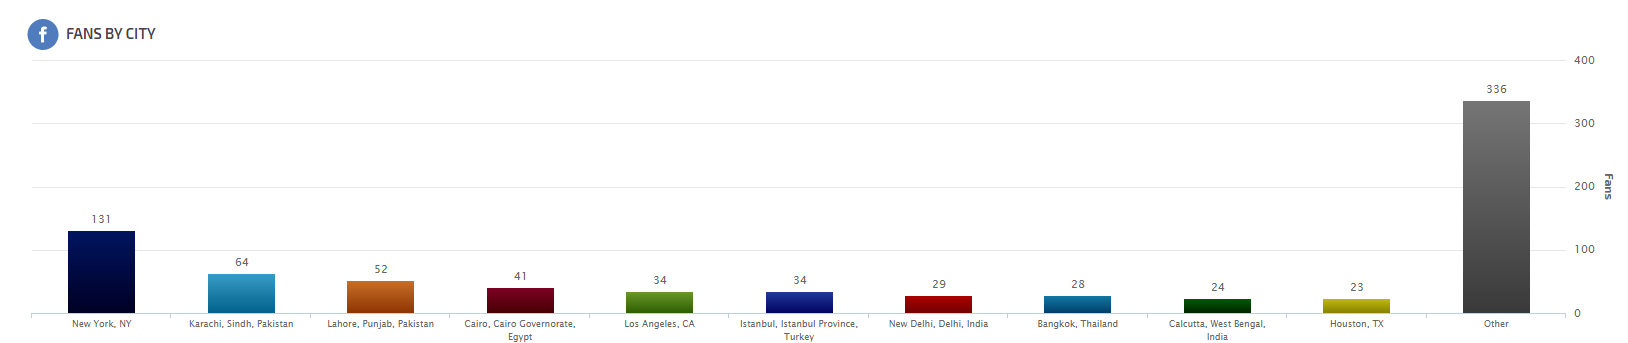
Data for all fan Cities (provided that the users have indicated their city in their Facebook profile) is displayed in table format.

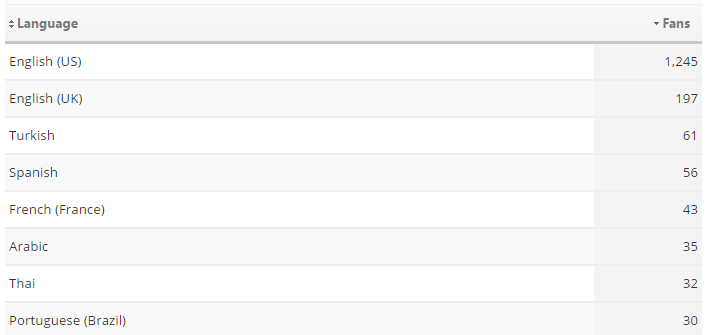
This section of the Facebook Insights Audience report offers a segmentation of the Facebook page fans according to language. The top 10 languages are displayed, with the rest grouped together in the 'Other' column.
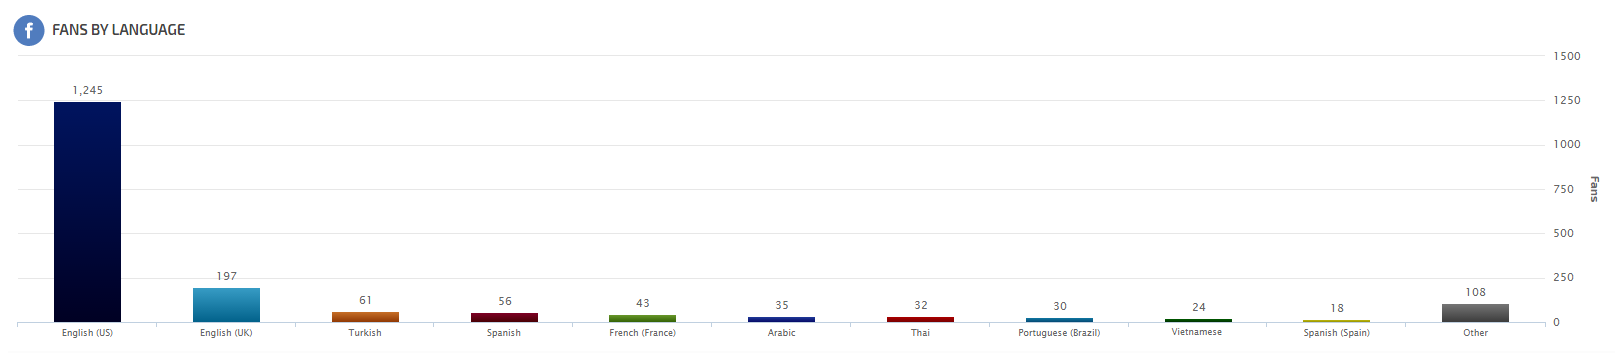
Data for all fan languages is displayed in table format.
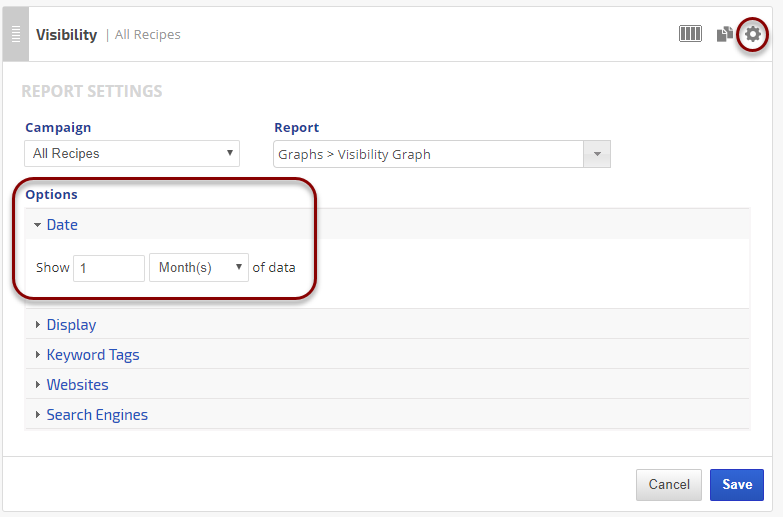
Important: Click the Apply Changes button to update the report
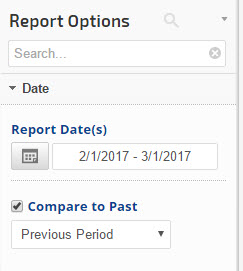 |
Report Dates
|
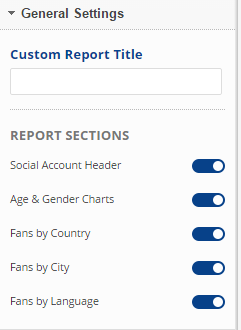 |
General Settings
|
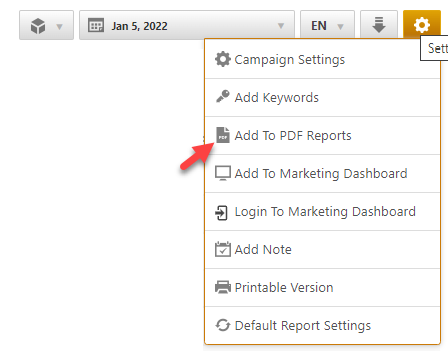
Add to PDF Report
Conveniently add a report or graph with its current settings to a PDF report by hovering over the gold gear icon and selecting Add to PDF Reports
Select the PDF Report that you want the report or graph added to
Drag the new report or graph into the position you want it to display in the PDF and confirm that the Date settings do not conflict with the automated scheduling settings.
Add to Marketing Dashboard
Conveniently add a report or graph with its current settings to a marketing dashboard:
1. Hover over the gold gear icon and select Add to Marketing Dashboard
2. Select the Dashboard (campaign name)
3. Select the Dashboard Page that you want the report added to

1. Hover over the gold gear icon and select Add to Marketing Dashboard
2. Select the Dashboard (campaign name)
3. Select the Dashboard Page that you want the report added to
4. Click the "Go to Dashboard" link to further customize the report (e.g., drag it to a specific position on the page, change date settings, etc.)

Refer to the Report Options section for details regarding the display settings, filters and sort options available for this report.
The report date (or date range) is governed by the selected Dashboard date option: Date Selection or Fixed Periods, learn more...
- Daily reports default to the last day of the selected period
- Weekly and monthly reports default to 1 month of data